More Ways to Deal with Market Uncertainty
- Don’t count on good luck to thrive in volatile markets
- Uncertainty can be caused by conflicting news or no news
- Technical analysis tools offer market information at all times
- U.S. natural gas takeaway capacity increases again in 2024
Sincerely,
David Thompson, CMT
Executive Vice President
Powerhouse
(202) 333-5380

The Matrix
Our previous Weekly Energy Market Situation discussed certain hedging strategies that can help marketers succeed in volatile trading environments. Options strategies can provide value because they speak to a very real customer concern – “I’m unsure if the market is going up or down.”
Uncertainty is often caused by conflicting (or non-existent) news about what is moving the market. Technical analysis offers evidence-based tools to aid decision-making in this all-too-common environment. Charts and indicators don’t care about the ‘why’. They measure ‘how much’ and ‘when’. This is important because marketers have to make decision on when to acquire inventory or how much further a market move might go.
What can a chart tell you when the headlines offer more confusion than help? The current ULSD chart below offers several insights.
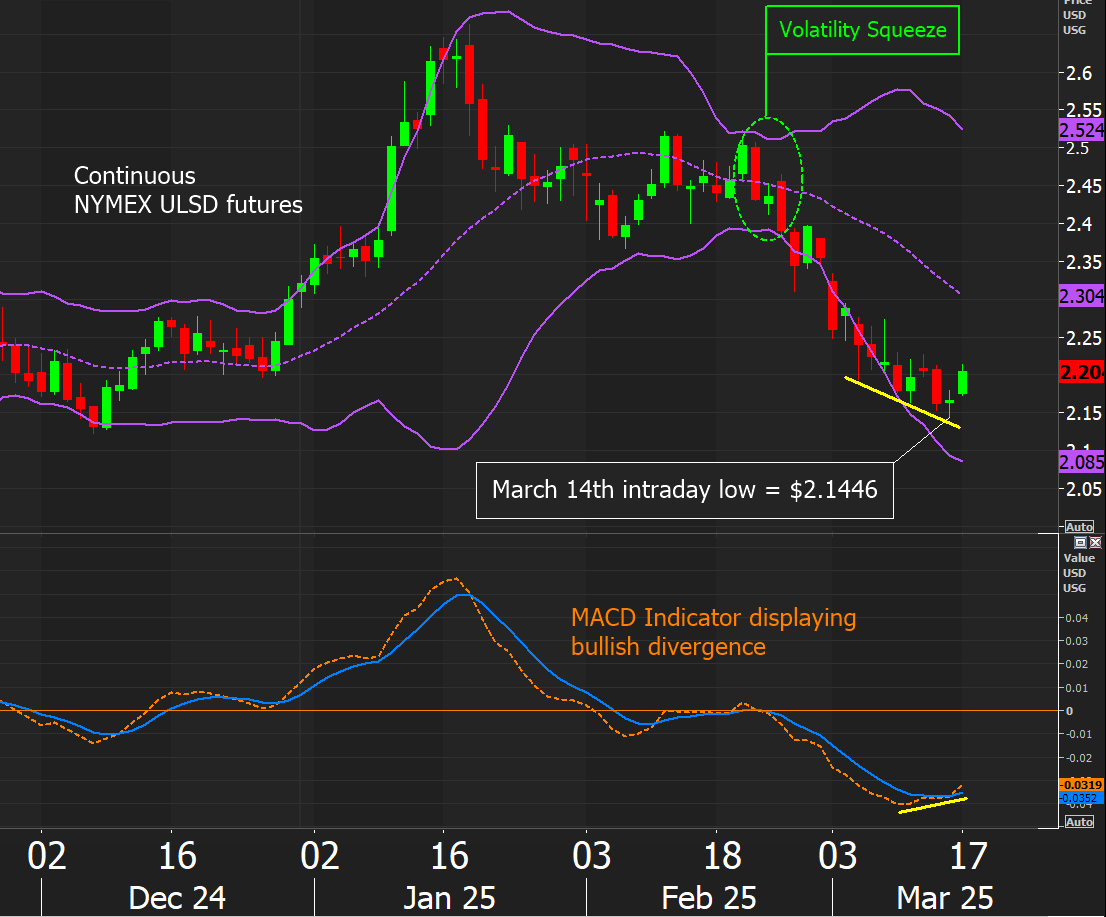
Source: LSEG
- The dotted green circle highlighted a noticeable reduction in volatility, a squeeze, as measured by the Bollinger Bands indicator. This offered an opportunity for options buyers.
- The yellow lines, slanting in opposite directions, indicate that bullish divergence is starting to develop. This means that while price has continued to grind lower, the MACD indicator in the bottom panel is showing signs of internal strength as it has made consecutive ‘higher lows.’
- The intraday low of $2.1446 noted in white offers point of caution for anyone who holds long positions. We don’t have to know which exact headline made the difference on that day. A move below this significant level will likely reignite bearish sentiment.
Don’t feel paralyzed when news stories conflict. Technical analysis tools are always available to provide objective information. A price chart is a real-time measurement of the intensity of buying and selling in the market. Sustained intensity generates price trends. In many cases, you can see it in the chart before you can read it in the news.
Whether you want a quick read on a chart or a deeper dive into trends, POWERHOUSE is your outsourced technical analysis desk.
Supply/Demand Balances
Supply/demand data in the United States for the week ended March 7, 2025, were released by the Energy Information Administration.
Total commercial stocks of petroleum decreased (⬇) 6.0 million barrels to 1.1993 billion barrels during the week ended March 7th, 2025.
Commercial crude oil supplies in the United States were higher (⬆) by 1.4 million barrels from the previous report week to 435.2 million barrels.
Crude oil inventory changes by PAD District:
PADD 1: Up (⬆) 0.4 million barrels to 8.6 million barrels
PADD 2: Down (⬇) 1.9 million barrels to 107.8 million barrels
PADD 3: Up (⬆) 4.0 million barrels to 248.8 million barrels
PADD 4: Down (⬇) 0.2 million barrels to 24.4 million barrels
PADD 5: Down (⬇) 0.9 million barrels to 45.6 million barrels
Cushing, Oklahoma, inventories were down (⬇) 1.2 million barrels to 24.5 million barrels.
Domestic crude oil production increased (⬆) 67,000 barrels per day from the previous report at 13.575 million barrels per day.
Crude oil imports averaged 5.470 million barrels per day, a daily decrease (⬇) of 343,000 barrels. Exports decreased (⬇) 846,000 barrels daily to 3.290 million barrels per day.
Refineries used 86.5% of capacity; an increase (⬆) of 0.6% from the previous report week.
Crude oil inputs to refineries increased (⬆) 321,000 barrels daily; there were 15.708 million barrels per day of crude oil run to facilities. Gross inputs, which include blending stocks, increased (⬆) 113,000 barrels daily to 15.880 million barrels daily.
Total petroleum product inventories decreased (⬇) by 7.4 million barrels from the previous report week, up to 764.1 million barrels.
Total product demand increased (⬆) 1,058,000 barrels daily to 21.600 million barrels per day.
Gasoline stocks decreased (⬇) 5.7 million barrels from the previous report week; total stocks are 241.1 million barrels.
Demand for gasoline increased (⬆) 305,000 barrels per day to 9.182 million barrels per day.
Distillate fuel oil stocks decreased (⬇) 1.6 million barrels from the previous report week; distillate stocks are at 117.6 million barrels. EIA reported national distillate demand at 3.898 million barrels per day during the report week, a decrease (⬇) of 93,000 barrels daily.
Propane stocks fell (⬇) 3.4 million barrels from the previous report to 45.3 million barrels. The report estimated current demand at 1,609,000 barrels per day, an increase (⬆) of 551,000 barrels daily from the previous report week.
Natural Gas
While the announcement of new liquefaction plants garners the most news coverage, another key component of the LNG export process showed advances over the course of 2024. According to the EIA, the U.S. added 17.8 billion cubic feet per day (bcfd) of takeaway capacity
in 2024. The agency highlighted that total pipeline capacity additions have increased for two years in a row.
Completed projects included pipelines to move gas from Appalachia, Louisiana and Texas to consuming regions in the Mid-Atlantic and Gulf Coast. Of the total, five new pipelines in Texas and Louisiana with 8.5 bcfd of capacity will deliver natural gas to LNG export facilities.
According to the EIA:
- Net withdrawals from storage totaled 62 Bcf for the week ended March 7, compared with the five-year (2020–24) average net withdrawals of 56 Bcf and last year’s net withdrawals of 19 Bcf during the same week. Working natural gas stocks totaled 1,698 Bcf, which is 230 Bcf (12%) lower than the five-year average and 628 Bcf (27%) lower than last year at this time.
- According to The Desk survey of natural gas analysts, estimates of the weekly net change to working natural gas stocks ranged from net withdrawals of 36 Bcf to 87 Bcf, with a median estimate of 50 Bcf.
- The average rate of withdrawals from storage is 25% higher than the five-year average so far in the withdrawal season (November through March). If the rate of withdrawals from storage matched the five-year average of 2.8 Bcf/d for the remainder of the withdrawal season, the total inventory would be 1,630 Bcf on March 31, which is 230 Bcf lower than the five-year average of 1,860 Bcf for that time of year.
Was this helpful? We’d like your feedback.
Please respond to [email protected]
This material has been prepared by a sales or trading employee or agent of Powerhouse Brokers, LLC and is, or is in the nature of, a solicitation. This material is not a research report prepared by Powerhouse Brokers, LLC. By accepting this communication, you agree that you are an experienced user of the futures markets, capable of making independent trading decisions, and agree that you are not, and will not, rely solely on this communication in making trading decisions.
DISTRIBUTION IN SOME JURISDICTIONS MAY BE PROHIBITED OR RESTRICTED BY LAW. PERSONS IN POSSESSION OF THIS COMMUNICATION INDIRECTLY SHOULD INFORM THEMSELVES ABOUT AND OBSERVE ANY SUCH PROHIBITION OR RESTRICTIONS. TO THE EXTENT THAT YOU HAVE RECEIVED THIS COMMUNICATION INDIRECTLY AND SOLICITATIONS ARE PROHIBITED IN YOUR JURISDICTION WITHOUT REGISTRATION, THE MARKET COMMENTARY IN THIS COMMUNICATION SHOULD NOT BE CONSIDERED A SOLICITATION.
The risk of loss in trading futures and/or options is substantial and each investor and/or trader must consider whether this is a suitable investment. Past performance, whether actual or indicated by simulated historical tests of strategies, is not indicative of future results. Trading advice is based on information taken from trades and statistical services and other sources that Powerhouse Brokers, LLC believes are reliable. We do not guarantee that such information is accurate or complete and it should not be relied upon as such. Trading advice reflects our good faith judgment at a specific time and is subject to change without notice. There is no guarantee that the advice we give will result in profitable trades.
Copyright 2025 Powerhouse Brokers, LLC, All rights reserved