Petroleum Prices Remain Volatile
- HO prices develop strong carry
- RBOB prices break support
- Multiple influences confound analysis
- Natural gas rally fails

The Matrix
The petroleum futures markets traded in dramatic ranges during the week ending March 13, 2020. Traders worked to absorb the chaotic news that overwhelmed financial news. An emerging global pandemic of COVID-19, the spectacular explosion of OPEC+ and a decline in the equity markets that brought financial markets into bear-market territory. A bear market is generally defined as a decline of 20 percent since the prior high. The S&P turned bearish; several European exchanges registered substantial decreases.
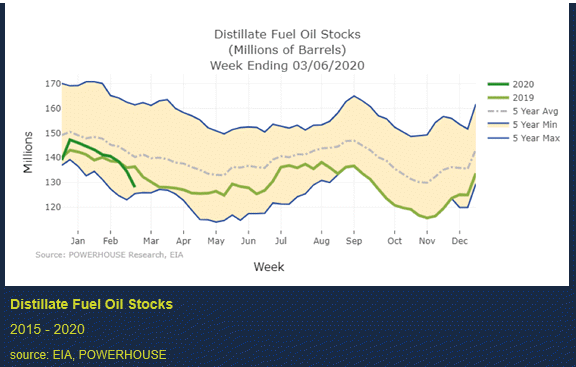
ULSD spot futures ranged between $1.08 and $1.3025 during the week. More distant months were higher priced, creating an opportunity for those with access to storage to fix a significant margin. The carry between April 2020 and January 2021 was nearly 18 cents as the market settled for the week on Friday. ULSD’s ability to hold support in a generally soft oil market suggests the commodity’s effort to form a bottom. Stocks of distillate fuel have been falling since early January, and with refinery usage near a seasonal low, ULSD prices could typically be expected to rally. The market situation is chaotic at best and “typical” offers very little support for trading decisions.
Wholesale gasoline prices followed equity markets lower. Gasoline retailers’ profit margins, as defined by the national average gross rack-to-retail margin for regular unleaded gasoline hit a record of slightly over 69cts/gal Friday. This move occured as gasoline crack spreads lost over 95% in one trading week. Despite the massive stress imposed on all markets, the inverse relationship between retail margins and crack spreads has sustained.
Market moving information in the current environment is abundant, and unfiltered can move prices randomly. Grimmer news about COVID-19 or more inflammatory cross-talk among foreign oil producers could move the market unpredictably. It’s a valuable aphorism that tells us when the situation is uncertain, trade small. Caution is useful advice in this volatile market situation.
Supply/Demand Balances
Supply/demand data in the United States for the week ending March 6, 2020, were released by the Energy Information Administration.
Total commercial stocks of petroleum fell by 7.6 million barrels during the week ending March 6, 2020.
Commercial crude oil supplies in the United States increased by 7.7 million barrels from the previous report week to 451.8 million barrels.
Crude oil inventory changes by PAD District:
PADD 1: Plus 0.9 million barrels to 11.2 million barrels
PADD 2: Plus 2.4 million barrels to 126.7 million barrels
PADD 3: Plus 6.7 million barrels to 242.2 million barrels
PADD 4: UNCH from the previous report week at 20.5 million barrels
PADD 5: Down 1.8 million barrels to 51.2 million barrels
Cushing, Oklahoma inventories were up 0.7 million barrels from the previous report week to 37.9 million barrels.
Domestic crude oil production fell 100,000 barrels per day from the previous report week to 13.0 million barrels daily.
Crude oil imports averaged 6.412 million barrels per day, a daily increase of 174,000 barrels. Exports fell 744,000 barrels daily to 3.41 million barrels per day.
Refineries used 86.4 percent of capacity, down 0.5% from the previous report week.
Crude oil inputs to refineries increased 6,000 barrels daily; there were 15.702 million barrels per day of crude oil run to facilities. Gross inputs, which include blending stocks, fell 100,000 barrels daily to reach 16.248 million barrels daily.
Total petroleum product inventories fell 12.7 million barrels from the previous report week.
Gasoline stocks decreased 5.0 million barrels daily from the previous report week; total stocks are 247.0 million barrels.
Demand for gasoline rose 263,000 barrels per day to 9.449 million barrels per day.
Total product demand increased 588,000 barrels daily to 21.860 million barrels per day.
Distillate fuel oil stocks decreased 6.4 million barrels from the previous report week; distillate stocks are at 128.1 million barrels. EIA reported national distillate demand at 3.919 million barrels per day during the report week, an decrease of 201,000 barrels daily.
Propane stocks decreased 2.9 million barrels from the previous report week; propane stocks are 67.0 million barrels. The report estimated current demand at 1.461 million barrels per day, a decrease of 330,000 barrels daily from the previous report week.
Natural Gas
An effort to move natural gas futures higher failed just below $2.00. Part of the rally may have reflected emerging expectations of reduced natural gas supply. Failure to achieve meaningful HHDs and concerns that possible loss of new oil production (with its associated natural gas) were too bearish to overcome. NOAA reports that the United States generated nearly 400 heating degree days fewer than last year at this time, an eleven percent shortfall. The Middle Atlantic states were 12 percent behind last year.
According to EIA:
The net withdrawal from storage totaled 48 Bcf for the week ending March 6, compared with the five-year (2015–19) average net withdrawal of 99 Bcf and last year’s net withdrawal of 164 Bcf during the same week. Working natural gas stocks totaled 2,043 Bcf, which is 227 Bcf more than the five-year average and 796 Bcf more than last year at this time.
The average rate of withdrawal from storage is 10% lower than the five-year average so far in the withdrawal season (November through March). If the rate of withdrawal from storage matched the five-year average of 4.7 Bcf/d for the remainder of the withdrawal season, the total inventory would be 1,924 Bcf on March 31, which is 227 Bcf higher than the five-year average of 1,697 Bcf for that time of year.
Futures trading involves significant risk and is not suitable for everyone. Transactions in securities futures, commodity and index futures and options on future markets carry a high degree of risk. The amount of initial margin is small relative to the value of the futures contract, meaning that transactions are heavily “leveraged.” A relatively small market movement will have a proportionately larger impact on the funds you have deposited or will have to deposit: this may work against you as well as for you. You may sustain a total loss of initial margin funds and any additional funds deposited with the clearing firm to maintain your position. If the market moves against your position or margin levels are increased, you may be called upon to pay substantial additional funds on short notice to maintain your position. If you fail to comply with a request for additional funds within the time prescribed, your position may be liquidated at a loss and you will be liable for any resulting deficit. Past performance may not be indicative of future results. This is not an offer to invest in any investment program.
Powerhouse is a registered affiliate of Coquest, Inc.
Was this helpful? We’d like your feedback.
Please respond to [email protected]
Copyright© 2020 Powerhouse, All rights reserved.


