Oil Prices Move Lower—But for How Long?
- Oil supply and demand balance remains tight
- Price reaction seems overdone to some observers
- Futures chart data may be signaling a shift in sentiment
- Alternative natural gas supplies for Europe are in the pipeline

Alan Levine—Chairman, Powerhouse
(202) 333-5380
The Matrix
Futures markets have exhibited wild swings in the past two weeks. ULSD has been the focus of market concern, reflecting remarkably tight domestic inventories and concerns for demand in a winter not quite yet finished. A heavy slate of refinery slowdowns/shutdowns contribute to anxiety over supply and price. Similar, if not quite so dramatic observations can be made for the other major futures contracts.
Some observers have even questioned the intensity of the markets’ reactions. Nobel economist, Paul Krugman, was “puzzled by the size of this price spike … [Russia] accounts for only about 11 percent of world production, whereas Persian Gulf producers extracted a third of the world’s oil back in the ‘70’s.” He notes that “the world economy is much less dependent on oil than it used to be. Oil “intensity” — the number of barrels of oil consumed per real dollar of gross domestic product—is half what it was in the 1970s.”
Fraught supply conditions (and little help from demand) have not been enough to keep markets from behaving as markets typically do—euphoric rallies and G-force inducing sell-offs.
Markets have their own logic. Indeed, they may react to internal data not often seen by the public. These include candlestick patterns, open interest, volatility, and margin requirements dictated by the exchanges and clearing merchants. Today, Powerhouse comments on the latest candlesticks.

ULSD Daily Prices Week Ending Mar 11, 2022 Source: Morgan Stanley Note: Candlesticks for each day show the daily range at the ends of each bar. The oblong box (the “body”) shows the opening and closing of each day. The color of the box indicates a higher (green) close or a lower (red) daily close.
Candlesticks show the intensity of price action over the past two weeks. Prices of ULSD bottomed on February 18 at $2.72 and advanced slowly until March 1. A low of $2.92 was seen then. Prices topped on March 9, at $4.67, a move of $1.75. Prices turned dramatically on that day, and by weekend, March 11, gave up $1.50, almost all its rally. ULSD futures wound up at $3.42.
Chart followers may see a “key reversal day” on the day of March 9. This occurs when price action makes a new intraday high for the move and then closes below the low of the two prior trading days. It may indicate the end of the rally and a reversal of sentiment. Its logic is that buyers, in control early in the day, were not able to stem the tide of sellers entering the market and allowing prices to print below the previous two days low. It could portend a change in trend.
Whether this will be the case here is still to be seen. Nonetheless, it reminds us that no trend goes forever, and while new highs may lie ahead (demand is still strong and supply, not so much) consolidation may occupy the next period. Buyers could consider using this pause to establish new length.
The effect of open interest, volatility and imposed margins on prices will be considered in the next weeks.
Supply/Demand Balances
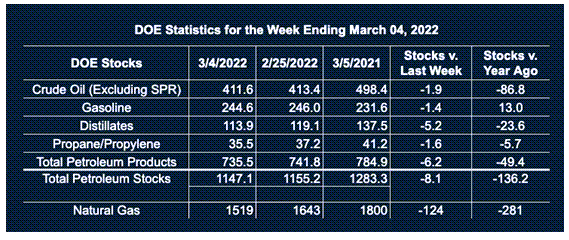
Supply/demand data in the United States for the week ending March 4, 2022, were released by the Energy Information Administration.
Total commercial stocks of petroleum fell 8.1 million barrels during the week ended March 4, 2022.
Commercial crude oil supplies in the United States decreased by 1.9 million barrels from the previous report week to 411.6 million barrels.
Crude oil inventory changes by PAD District:
PADD 1: Plus 0.5 million barrels to 7.6 million barrels
PADD 2: Down 1.1 million barrels to 100.8 million barrels
PADD 3: Down 1.1 million barrels to 229.3 million barrels
PADD 4: Down 0.6 million barrels to 23.5 million barrels
PADD 5: Plus 0.4 million barrels to 50.4 million barrels
Cushing, Oklahoma, inventories were down 0.6 million barrels from the previous report week to 22.2 million barrels.
Domestic crude oil production was unchanged from the previous report week at 11.6 million barrels daily.
Crude oil imports averaged 6.319 million barrels per day, a daily increase of 552,000 barrels. Exports decreased 1,374,000 barrels daily to 2.422 million barrels per day.
Refineries used 89.3% of capacity; 1.6 percentage points higher from the previous report week.
Crude oil inputs to refineries decreased 21,000 barrels daily; there were 15.967 million barrels per day of crude oil run to facilities. Gross inputs, which include blending stocks, rose 63,000 barrels daily to 15.967 million barrels daily.
Total petroleum product inventories fell 6.2 million barrels from the previous report week.
Gasoline stocks decreased 1.4 million barrels from the previous report week; total stocks are 244.6 million barrels.
Demand for gasoline rose by 219,000 barrels per day to 8.962 million barrels per day.
Total product demand increased 381,000 barrels daily to 21.21 million barrels per day.
Distillate fuel oil stocks decreased 5.2 million barrels from the previous report week; distillate stocks are at 113.9 million barrels. EIA reported national distillate demand at 4.587 million barrels per day during the report week, an increase of 137,000 barrels daily.
Propane stocks decreased 1.6 million barrels from the previous report week; propane stocks are at 35.5 million barrels. The report estimated current demand at 1.188 million barrels per day, a decrease of 289,000 barrels daily from the previous report week.
Natural Gas
Russia’s importance to natural gas supply in Europe has long been recognized. The country provides about 30 percent of European demand. The potential threat to regional security has been a topic of concern to European economic and military planners as well. Russia has used its natural gas as a political cudgel before.
The implications of Russian invasion into Ukraine are reviving ideas of how alternative supply sources might be developed. These focus on new natural gas supply from non-Russian sources and expansion of renewable energy.
The United States has become an important candidate for reliable gas supply to Europe. Some advocates for U.S. LNG exports to the EU have suggested that such supplies could be new policy successes like the postwar Berlin Airlift and the Marshall Plan, confirming a leading place in global political/economic activity.
There are 14 LNG projects, mostly on the Gulf Coast, approved but not yet under construction. They await financial support from the private sector. Moreover, long-term agreements with European utilities have still to be clinched.
Germany plans to build two import terminals to reduce reliance on Russian gas. And in the near-term, the U.S. has about tapped out its own export capability. One source estimates seventy percent of U.S. LNG outflows went to Europe. Denmark plans a pipeline from the North Sea to Poland. Qatar is expected to open a new facility in 2025.
All these new plans need financing, or course, and Europe is expediting approvals for several renewable energy projects. In any case, a new enthusiasm for diversity has clearly emerged.
According to the EIA:
The net withdrawals from storage totaled 124 Bcf for the week ending March 4, compared with the five-year (2017–2021) average net withdrawals of 89 Bcf and last year’s net withdrawals of 59 Bcf during the same week. Working natural gas stocks totaled 1,519 Bcf, which is 290 Bcf lower than the five-year average and 281 Bcf lower than last year at this time.
Was this helpful? We’d like your feedback.
Please respond to [email protected]
Powerhouse Futures & Trading Disclaimer
Copyright 2021 Powerhouse Brokerage, LLC, All rights reserved