What to Do When You Don’t Know What to Do
- Uncertainty returns with tweets and tariffs
- Consumer confidence readings dent the economic outlook
- Companies can avoid uncertainty paralysis
- U.S. LNG plays a role in tariff negotiations
Sincerely,
David Thompson, CMT
Executive Vice President
Powerhouse
(202) 333-5380
The Matrix
The widely anticipated market uncertainty has indeed reappeared with the return of the Trump Administration. Business and consumer confidence readings have been rattled with the rapid-fire policy announcements. The re-occurring theme of our recent conversations with clients has been, “I’m not sure what’s going to happen next.”
Uncertainty is precisely the reason companies implement hedging programs. This may be self-serving for POWERHOUSE to say, but it’s true. It’s also more than that. A hedging program incorporating options can protect a company from adverse effects of a price move in one
direction while allowing it to benefit from a move in the opposite direction. Hedgers who buy options position themselves to benefit from exceptional volatility and uncertainty rather than suffer from it.
The world of sports provides a perfect example of a hedging strategy in action. In 2006, the British Open was contested at the Royal Liverpool Golf Club at Hoylake, (in)famous for its pot bunkers.
Tiger Woods was the dominant player in the game in 2006, but he knew the pot bunkers could be his undoing. After the tournament he explained his strategy,
“When I got to Hoylake I had to decide whether to lay up to the fairway bunkers or try to fly them. They had redone the bunkers, and you couldn’t advance the ball. There were some that you had to hit it out sideways. By staying with my plan, I think I hit over 80% of the fairways utilizing a 3-wood and a 2-iron. I had three eagles that week and nothing bigger than my seven bogeys.”
It was ‘boring’ golf from Tiger. His ferocious drives were banished for the week. So too were any devastating triple bogeys. He won by two strokes.
The answer of what to do when you don’t know what is coming next is to follow a plan that allows your company to thrive in times of certainty. Take disasters out of play while still giving yourself (and your customers) a chance to succeed. POWERHOUSE is ready to carry your bag as you navigate the course ahead.
Supply/Demand Balances
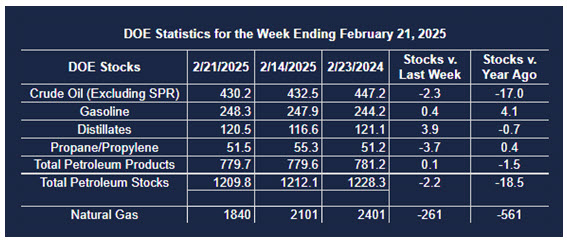
Supply/demand data in the United States for the week ended February 28, 2025, were released by the Energy Information Administration.
Total commercial stocks of petroleum decreased (⬇) 4.6 million barrels to 1.2052 billion barrels during the week ended February 28th, 2025.
Commercial crude oil supplies in the United States were higher (⬆) by 3.6 million barrels from the previous report week to 433.8 million barrels.
Crude oil inventory changes by PAD District:
PADD 1: Up (⬆) 1.3 million barrels to 8.2 million barrels
PADD 2: Up (⬆) 2.3 million barrels to 109.7 million barrels
PADD 3: Up (⬆) 1.6 million barrels to 244.8 million barrels
PADD 4: Unchanged (=) at 24.6 million barrels
PADD 5: Down (⬇) 1.6 million barrels to 46.5 million barrels
Cushing, Oklahoma, inventories were up (⬆) 1.1 million barrels to 25.7 million barrels.
Domestic crude oil production increased (⬆) 6,000 barrels per day from the previous report at 13.508 million barrels per day.
Crude oil imports averaged 5.813 million barrels per day, a daily decrease (⬇) of 106,000 barrels. Exports decreased (⬇) 52,000 barrels daily to 4.136 million barrels per day.
Refineries used 85.9% of capacity; a decrease (⬇) of 0.6% from the previous report week.
Crude oil inputs to refineries decreased (⬇) 346,000 barrels daily; there were 15.387 million barrels per day of crude oil run to facilities. Gross inputs, which include blending stocks, decreased (⬇) 113,000 barrels daily to 15.767 million barrels daily.
Total petroleum product inventories decreased (⬇) by 8.1 million barrels from the previous report week, up to 771.5 million barrels.
Total product demand decreased (⬇) 300,000 barrels daily to 20.543 million barrels per day.
Gasoline stocks decreased (⬇) 1.4 million barrels from the previous report week; total stocks are 246.8 million barrels.
Demand for gasoline increased (⬆) 423,000 barrels per day to 8.877 million barrels per day.
Distillate fuel oil stocks decreased (⬇) 1.3 million barrels from the previous report week; distillate stocks are at 119.2 million barrels. EIA reported national distillate demand at 3.991 million barrels per day during the report week, a decrease (⬇) of 106,000 barrels daily.
Propane stocks fell (⬇) 2.9 million barrels from the previous report to 48.7 million barrels. The report estimated current demand at 1,058,000 barrels per day, a decrease (⬇) of 861,000 barrels daily from the previous report week.
Natural Gas
The Trump Administration’s tariff campaign to eliminate the U.S. trade deficit is also affecting the natural gas market. Despite upending decades-old trade relationships, foreign demand for U.S. LNG is likely set to increase.
India, the second-largest U.S. trading partner and the world’s third-largest oil consumer, announced that they plan to buy an additional $10 billion of U.S. energy, most likely LNG. Similar statements have been made by European and Japanese leaders. Buying U.S. LNG
may represent a significant lever for countries to reduce their trade gaps with the U.S. and avoid the threat of tariffs.
Demand growth for natural-gas derived power is not limited to the U.S. data centers. The effect of this new demand on Henry Hub futures prices will be governed by the growth rate of LNG export facilities. POWERHOUSE will pay close attention to substantive developments in U.S. export capacity.
According to the EIA:
- Net withdrawals from storage totaled 80 Bcf for the week ended February 28, compared with the five-year (2020–24) average net withdrawals of 94 Bcf and last year’s net withdrawals of 56 Bcf during the same week. Working natural gas stocks totaled 1,760 Bcf, which is 224 Bcf (11%) lower than the five-year average and 585 Bcf (25%) lower than last year at this time.
- According to The Desk survey of natural gas analysts, estimates of the weekly net change to working natural gas stocks ranged from net withdrawals of 66 Bcf to 102 Bcf, with a median estimate of 93 Bcf.
- The average rate of withdrawals from storage is 25% higher than the five-year average so far in the withdrawal season (November through March). If the rate of withdrawals from storage matched the five-year average of 4.0 Bcf/d for the remainder of the withdrawal season, the total inventory would be 1,636 Bcf on March 31, which is 224 Bcf lower than the five-year average of 1,860 Bcf for that time of year.
Was this memo helpful? We’d like your feedback.
Please respond to [email protected]
This material has been prepared by a sales or trading employee or agent of Powerhouse Brokers, LLC and is, or is in the nature of, a solicitation. This material is not a research report prepared by Powerhouse Brokers, LLC. By accepting this communication, you agree that you are an experienced user of the futures markets, capable of making independent trading decisions, and agree that you are not, and will not, rely solely on this communication in making trading decisions.
DISTRIBUTION IN SOME JURISDICTIONS MAY BE PROHIBITED OR RESTRICTED BY LAW. PERSONS IN POSSESSION OF THIS COMMUNICATION INDIRECTLY SHOULD INFORM THEMSELVES ABOUT AND OBSERVE ANY SUCH PROHIBITION OR RESTRICTIONS. TO THE EXTENT THAT YOU HAVE RECEIVED THIS COMMUNICATION INDIRECTLY AND SOLICITATIONS ARE PROHIBITED IN YOUR JURISDICTION WITHOUT REGISTRATION, THE MARKET COMMENTARY IN THIS COMMUNICATION SHOULD NOT BE CONSIDERED A SOLICITATION.
The risk of loss in trading futures and/or options is substantial and each investor and/or trader must consider whether this is a suitable investment. Past performance, whether actual or indicated by simulated historical tests of strategies, is not indicative of future results. Trading advice is based on information taken from trades and statistical services and other sources that Powerhouse Brokers, LLC believes are reliable. We do not guarantee that such information is accurate or complete and it should not be relied upon as such. Trading advice reflects our good faith judgment at a specific time and is subject to change without notice. There is no guarantee that the advice we give will result in profitable trades.
Copyright 2025 Powerhouse Brokers, LLC, All rights reserved