Crude Oil Prices Push Higher
- July crude oil futures break resistance
- Post-COVID-19 demand gains
- Oil is part of a larger commodities move
- Natural gas injections into storage are 6% lower than the five-year average

Alan Levine—Chairman, Powerhouse
(202) 333-5380
The Matrix
WTI crude oil July futures broke to new highs during the week ended June 4, 2021. Prices reached $69.76 a barrel; a value last seen in October 2018 when WTI topped at $76.90 a barrel.
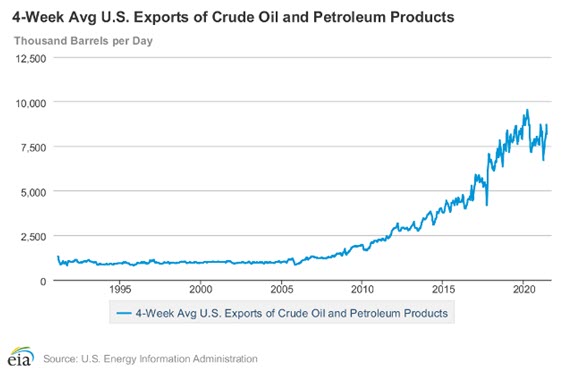
Crude oil prices have been generally rising since early November 2020 with the announcement of the successful Pfizer vaccine. The ostensible end of COVID-19 has unleashed pent-up retail demand and translates into greater oil demand. Oil exports have become a significant off-taker to U.S. storage availability.
Total exports reported by the Department of Energy for the week ended May 28 were 7.2 million barrels daily. Crude oil send-out was 2.5 million barrels daily. Product exports came to 4.6 million daily barrels.
Crude oil imports offset some of the export’s drain on domestic supply. These imports were put at 5.6 million barrels per day. Product imports were 2.6 million barrels daily.
The supply side of petroleum is tending bullish as well. Domestic crude oil production peaked on March 13, 2020, at 13.1 million barrels per day. As the COVID-19 lockdown took hold, U.S. production fell to 9.7 million barrels daily. Output has since stabilized around 11.0 million barrels daily. Further recovery in supply has run into resistance from investors now looking for a return on investment instead of increased production.
Bullish factors appear to be driving petroleum futures higher. There is also a larger bullish situation in the broader commodities markets. Commodities have been moving higher throughout 2021. Essentials like steel, copper, corn and lumber are pulling all commodities higher. The United States has added fiscal stimulus, raising expectations for inflation. Europe is starting to reopen, adding to the demand pull.
Crude oil price expectations for 2021 have been put at $80 by some analysts. Even higher projections are starting to appear. One of the banks is putting a price objective around $100.
Supply/Demand Balances
Supply/demand data in the United States for the week ended May 28, 2021, were released by the Energy Information Administration.
Total commercial stocks of petroleum rose by 1.9 million barrels during the week ended May 28, 2021.
Commercial crude oil supplies in the United States decreased by 5.1 million barrels from the previous report week to 479.3 million barrels.
Crude oil inventory changes by PAD District:
PADD 1: Plus 0.6 to 8.5 million barrels
PADD 2: Plus 0.6 million barrels to 133.4 million barrels
PADD 3: Down 5.6 million barrels to 264.8 million barrels
PADD 4: Down 0.5 million barrels to 24.8 million barrels
PADD 5: Down 0.1 million barrels to 47.8 million barrels
Cushing, Okla., inventories were plus 0.7 million barrels from the previous report week to 45.5 million barrels.
Domestic crude oil production was down 0.2 million barrels per day from the previous report to 10.8 million barrels daily.
Crude oil imports averaged 5.631 million barrels per day, a daily decrease of 641,000 barrels. Exports decreased 889,000 barrels daily to 2.544 million barrels per day.
Refineries used 88.7% of capacity, 1.7 percentage points higher from the previous report week.
Crude oil inputs to refineries increased 358,000 barrels daily; there were 15.239 million barrels per day of crude oil run to facilities. Gross inputs, which include blending stocks, rose 310,000 barrels daily to 16.052 million barrels daily.
Total petroleum product inventories rose 7.0 million barrels from the previous report week.
Gasoline stocks increased million barrels 1.5 from the previous report week; total stocks are 234.0 million barrels.
Demand for gasoline fell 333,000 barrels per day to 9.146 million barrels per day.
Total product demand decreased 817,000 barrels daily to 19.140 million barrels per day.
Distillate fuel oil stocks rose 3.7 million barrels from the previous report week; distillate stocks are at 132.8 million barrels. EIA reported national distillate demand at 3.813 million barrels per day during the report week, a decrease of 648,000 barrels daily.
Propane stocks rose 4.1 million barrels from the previous report week to 48.2 million barrels. The report estimated current demand at 1.031 million barrels per day, a decrease of 26,000 barrels daily from the previous report week.
Natural Gas
Spot natural gas futures have been frustrated trying to break to new highs. Prices at Henry Hub reached $3.15 on June 1 but could not hold that level. Cooling degree days are only slightly higher than normal.
According to the EIA:
The net injections [of natural gas] into storage totaled 98 Bcf for the week end[ed] May 28, compared with the five-year (2016–2020) average net injections of 96 Bcf and last year’s net injections of 103 Bcf during the same week. Working natural gas stocks totaled 2,313 Bcf, which is 61 Bcf lower than the five-year average and 386 Bcf lower than last year at this time.
The average rate of injections into storage is 6% lower than the five-year average so far in the refill season (April through October). If the rate of injections into storage matched the five-year average of 8.6 Bcf/d for the remainder of the refill season, the total inventory would be 3,658 Bcf on October 31, which is 61 Bcf lower than the five-year average of 3,719 Bcf for that time of year.
Was this helpful? We’d like your feedback.
Please respond to [email protected]
Powerhouse Futures & Trading Disclaimer
Copyright 2021 Powerhouse Brokerage, LLC, All rights reserved