OPEC+ Continues to Unwind Production Cuts
- OPEC+ increases crude oil production quotas
- Much of the most recent production curtailments now reversed
- Short-to-medium term crude demand remains supported
- USGS updates U.S. natural gas reserves
Sincerely,
David Thompson, CMT
Executive Vice President
Powerhouse
(202) 333-5380
The Matrix
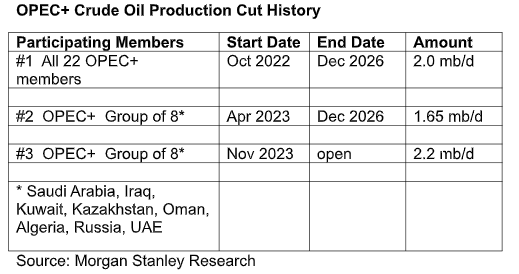
OPEC+ announced on May 31st that its July production level will increase by 411,000 barrels per day (b/d). This matches similar production increases that were made in May and June.
To put things in perspective, listed below are the most recent major production cuts taken by OPEC+. Saturday’s decision means the cartel has now brought back 1.233 million b/d from 2.2 million b/d cuts announced in November 2023.
The immediate market reaction once trading re-opened on Sunday evening was bullish — seemingly in contradiction the increase in supply. Some analysts had believed OPEC+ would increase production by a larger amount. Other market-watchers believe the actual production increase in May was closer to 275,000 b/d versus the announced 411,000 b/d. The recent Ukrainian drone strikes and hawkish rhetoric from senior Iranian officials on the status of de-nuclearization talks also contributed to the bullish price behavior.
OPEC+’s decision to bring more crude oil supply to the market was likely influenced by statistics showing a continuing trend of positive economic surprises in what is known as ‘hard data’ — objective, quantifiable information such as GDP or employment figures. Soft data, or information gleaned by surveys of market participants, has also been recovering to a more modest extent.

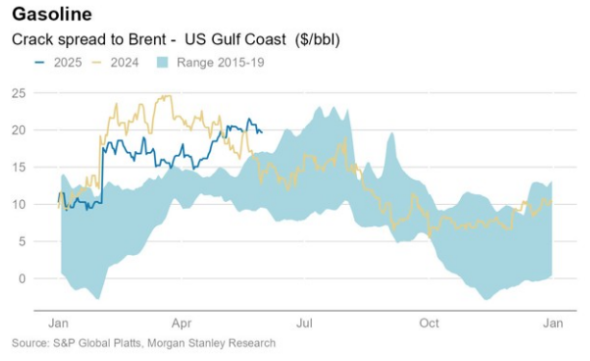
But the type of data that matters most to OPEC+ is crude oil demand. With refiners’ crack spreads remaining well above average across all global markets, that looks to remain strong as peak summer driving season approaches.
The open question for the markets is what happens as Labor Day approaches and seasonal tailwinds for demand fade. Several bank analysts believe that additional crude oil output from non-OPEC, non U.S. shale sources will start to weigh bearishly on price after August. This is evidenced by a return to carry in the crude market in Q1 2026.
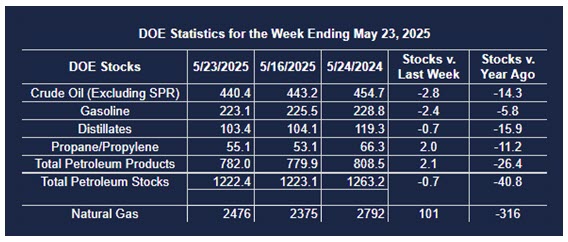
Supply/Demand Balances
Supply/demand data in the United States for the week ended May 23, 2025, were released by the Energy Information Administration.
Total commercial stocks of petroleum decreased (⬇) 0.7 million barrels to 1.2224 billion barrels during the week ended May 23rd, 2025.
Commercial crude oil supplies in the United States were lower (⬇) by 2.8 million barrels from the previous report week to 440.4 million barrels.
Crude oil inventory changes by PAD District:
PADD 1: Up (⬆) 0.1 million barrels to 8.7 million barrels
PADD 2: Up (⬆) 0.8 million barrels to 107.3 million barrels
PADD 3: Down (⬇) 3.2 million barrels to 248.2 million barrels
PADD 4: Down (⬇) 0.4 million barrels to 24.8 million barrels
PADD 5: Down (⬇) 0.3 million barrels to 51.2 million barrels
Cushing, Oklahoma, inventories were up (⬆) 0.1 million barrels to 23.5 million barrels.
Domestic crude oil production increased (⬆) 9,000 barrels per day from the previous report at 13.401 million barrels per day.
Crude oil imports averaged 6.351 million barrels per day, a daily increase (⬆) of 262,000 barrels. Exports increased (⬆) 794,000 barrels daily to 4.301 million barrels per day.
Refineries used 90.2% of capacity; a decrease (⬇) of 0.5% from the previous report week.
Crude oil inputs to refineries decreased (⬇) 162,000 barrels daily; there were 16.328 million barrels per day of crude oil run to facilities. Gross inputs, which include blending stocks, increased (⬇) 93,000 barrels daily to 16.600 million barrels daily.
Total petroleum product inventories increased (⬆) by 2.1 million barrels from the previous report week, up to 782.0 million barrels.
Total product demand increased (⬆) 211,000 barrels daily to 20.242 million barrels per day.
Gasoline stocks decreased (⬇) 2.4 million barrels from the previous report week; total stocks are 223.1 million barrels.
Demand for gasoline increased (⬆) 808,000 barrels per day to 9.452 million barrels per day.
Distillate fuel oil stocks decreased (⬇) 0.7 million barrels from the previous report week; distillate stocks are at 103.4 million barrels. EIA reported national distillate demand at 3.893 million barrels per day during the report week, an increase (⬆) of 480,000 barrels daily.
Propane stocks rose (⬆) 2.0 million barrels from the previous report to 55.1 million barrels. The report estimated current demand at 486,000 barrels per day, a decrease (⬇) of 354,000 barrels daily from the previous report week.
Natural Gas
Recent data from the U.S. Geological Survey (USGS) estimates that undiscovered offshore natural gas resources may be much larger than previously thought. Technically recoverable natural gas in the Hosston and Travis Peak formations are estimated at 35.8 trillion cubic feet (Tcf). This is as much as the United States consumes in 14 months at the current rate of consumption, USGS researchers said. Importantly, the USGS assessment looked at only a small portion of the Gulf Coast’s resource-rich rock formations.
With attention rightfully focused on the AI-driven demand side of the equation, it’s important not to neglect new developments on the supply side of the ledger.
According to the EIA:
- Net injections into storage totaled 101 Bcf for the week ended May 23, compared with the five-year (2020–24) average net injections of 98 Bcf and last year’s net injections of 84 Bcf during the same week. Working natural gas stocks totaled 2,476 Bcf, which is 93 Bcf (4%) more than the five-year average and 316 Bcf (11%) lower than last year at this time.
- According to The Desk survey of natural gas analysts, estimates of the weekly net change to working natural gas stocks ranged from net injections of 79 Bcf to 108 Bcf, with a median estimate of 101 Bcf.
Was this helpful? We’d like your feedback.
Please respond to [email protected]
This material has been prepared by a sales or trading employee or agent of Powerhouse Brokers, LLC and is, or is in the nature of, a solicitation. This material is not a research report prepared by Powerhouse Brokers, LLC. By accepting this communication, you agree that you are an experienced user of the futures markets, capable of making independent trading decisions, and agree that you are not, and will not, rely solely on this communication in making trading decisions.
DISTRIBUTION IN SOME JURISDICTIONS MAY BE PROHIBITED OR RESTRICTED BY LAW. PERSONS IN POSSESSION OF THIS COMMUNICATION INDIRECTLY SHOULD INFORM THEMSELVES ABOUT AND OBSERVE ANY SUCH PROHIBITION OR RESTRICTIONS. TO THE EXTENT THAT YOU HAVE RECEIVED THIS COMMUNICATION INDIRECTLY AND SOLICITATIONS ARE PROHIBITED IN YOUR JURISDICTION WITHOUT REGISTRATION, THE MARKET COMMENTARY IN THIS COMMUNICATION SHOULD NOT BE CONSIDERED A SOLICITATION.
The risk of loss in trading futures and/or options is substantial and each investor and/or trader must consider whether this is a suitable investment. Past performance, whether actual or indicated by simulated historical tests of strategies, is not indicative of future results. Trading advice is based on information taken from trades and statistical services and other sources that Powerhouse Brokers, LLC believes are reliable. We do not guarantee that such information is accurate or complete and it should not be relied upon as such. Trading advice reflects our good faith judgment at a specific time and is subject to change without notice. There is no guarantee that the advice we give will result in profitable trades.
Copyright 2025 Powerhouse Brokers, LLC, All rights reserved