Futures Prices Nearing a Top?
- EIA expects global crude supply to rise
- Worry over the economic impact of COVID-19 eases
- Prices of WTI and products diverging
- Higher CDDs raise natural gas prices

Alan Levine—Chairman, Powerhouse
(202) 333-5380
The Matrix
The June Short-Term Energy Outlook (STEO) forecasted limited price increases for Brent and West Texas Intermediate (WTI) crude oil because of growing production led by OPEC, Russia and the United States.
Higher demand for petroleum has continued as the bearish power of the pandemic weakens. STEO expects higher global crude oil production should lead to a more balanced petroleum market in 2022.
Private sector petroleum analysts have been more bullish, expecting crude oil to reach $80 per barrel. One analyst projects an objective near $100. Crude oil futures price charts are maintaining a bullish stance. New high prices have been seen almost every day since mid-May. WTI prices gained around $10 during this period.
Petroleum product prices had matched those of crude oil for most of the rally. The past few days have shown a small diversion in price action. ULSD and RBOB spot futures did not make a new high complementary to the pattern established earlier. Moreover, gasoline’s decline comes at the time when seasonality no longer favors RBOB. Support for gasoline stands at $1.98. ULSD could drop to support at $1.95.
STEO anticipates oil demand to reach 97.7 million barrels in 2021. This is a 6% increase; another 4% gain in 2022 puts demand at 101.3 million barrels daily. This could bring U.S. crude oil production at 11.8 million barrels per day in 2022. OPEC production could reach 28.7 million barrels daily.
Supply/Demand Balances
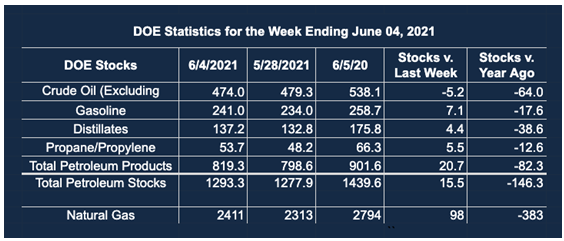
Supply/demand data in the United States for the week ended June 4, 2021, were released by the Energy Information Administration.
Total commercial stocks of petroleum rose by 15.5 million barrels during the week ended June 4, 2021.
Commercial crude oil supplies in the United States decreased by 5.2 million barrels from the previous report week to 479.3 million barrels.
Crude oil inventory changes by PADD District:
PADD 1: Plus 0.5 to 9.0 million barrels
PADD 2: Down 0.1 million barrels to 133.3 million barrels
PADD 3: Down 6.8 million barrels to 258.0 million barrels
PADD 4: Plus 0.1 million barrels to 24.9 million barrels
PADD 5: Plus 1.1 million barrels to 48.9 million barrels
Cushing, Oklahoma, inventories were plus 0.2 million barrels from the previous report week to 45.7 million barrels.
Domestic crude oil production was up 0.2 million barrels per day from the previous report to 11 million barrels daily.
Crude oil imports averaged 6.638 million barrels per day, a daily increase of 1.007 million barrels. Exports increased 387,000 barrels daily to 2.931 million barrels per day.
Refineries used 91.3% of capacity, 2.6 percentage points higher from the previous report week.
Crude oil inputs to refineries increased 328,000 barrels daily; there were 15.925 million barrels per day of crude oil run to facilities. Gross inputs, which include blending stocks, rose 465,000 barrels daily to 16.517 million barrels daily.
Total petroleum product inventories rose 20.7 million barrels from the previous report week.
Gasoline stocks increased 7.0 million barrels from the previous report week; total stocks are 241 million barrels.
Demand for gasoline fell 666,000 barrels per day to 8.48 million barrels per day.
Total product demand decreased 1.427 million barrels daily to 17.713 million barrels per day.
Distillate fuel oil stocks rose 4.4 million barrels from the previous report week; distillate stocks are at 137.2 million barrels. EIA reported national distillate demand at 3.413 million barrels per day during the report week, a decrease of 400,000 barrels daily.
Propane stocks rose 5.5 million barrels from the previous report week; propane stocks rose to 53.7 million barrels. The report estimated current demand at 750,000 barrels per day, a decrease of 281,000 barrels daily from the previous report week.
Natural Gas
July natural gas futures prices exploded as the week of June 11 ended. Prices reached $3.33, settling at $3.296 for the week. This nearly eclipsed resistance at $3.316 last seen on February 17.
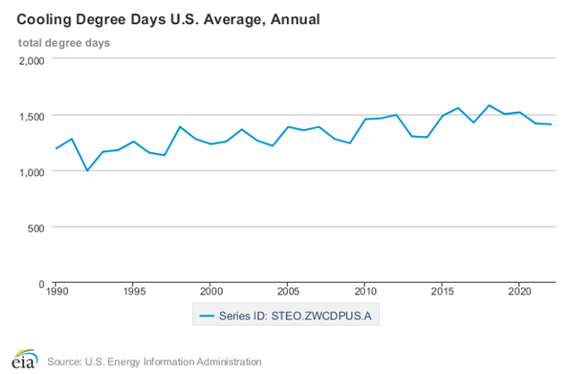
Increases in national natural gas consumption contributed to the rally. Cooling Degree Days grew as summer heat arrived. The United States generated 202 CDDs through the end of June 9. This was 13 degrees higher than normal; the Mid-Atlantic states saw 57 CDDs, 23 more CDDs than normal.
According to the EIA:
The net injections [of natural gas] into storage totaled 98 Bcf for the week ended June 4, compared with the five-year (2016–2020) average net injections of 92 Bcf and last year’s net injections of 95 Bcf during the same week. Working natural gas stocks totaled 2,411 Bcf, which is 55 Bcf lower than the five-year average and 383 Bcf lower than last year at this time.
The average rate of injections into storage is 4% lower than the five-year average so far in the refill season (April through October). If the rate of injections into storage matched the five-year average of 8.4 Bcf/d for the remainder of the refill season, the total inventory would be 3,664 Bcf on October 31, which is 55 Bcf lower than the five-year average of 3,719 Bcf for that time of year.
Was this helpful? We’d like your feedback.
Please respond to [email protected]
Powerhouse Futures & Trading Disclaimer
Copyright 2021 Powerhouse Brokerage, LLC, All rights reserved