Interconnected Energy Markets
- Technology and trade link various energy markets
- U.S. natural gas production now significantly linked to crude oil pricing
- Despite bullish demand signals, U.S. natural gas production might not increase
- LNG export demand growth primed to expand in coming years
Sincerely,
David Thompson, CMT
Executive Vice President
Powerhouse
(202) 333-5380
The Matrix
The interconnectedness of energy markets is one of the core themes The Energy Market Situation analyzes for its readers. Whether it is heating oil demand being spurred by natural gas interruptibles or economic weakness in China affecting diesel prices, there is an ever-changing feedback loop that continually affects energy prices.
POWERHOUSE has recently written about the impact of artificial intelligence (AI) on power demand and natural gas prices as well as the OPEC+ decision to increase crude oil production. These developments highlight yet another interconnection between energy markets. Natural gas that comes from oil-producing basins is known as ‘associated’ gas. In 2015, associated gas account for approximately 17% of total domestic production. Last year, nearly 30% of U.S. natural gas production came from oil-producing regions with the dramatic growth of Permian basin leading the way.

The interconnection comes from the fact that the decision to produce this gas is significantly affected by the price of crude oil. Several bank analysts are forecasting crude oil supply growth (both OPEC+ and non-OPEC) to create a surplus perhaps as early as Q4 2025.
As the WTI price drops, U.S. shale oil wells become ‘out-of-the money’ – the value of the oil the produce falls below their breakeven costs.
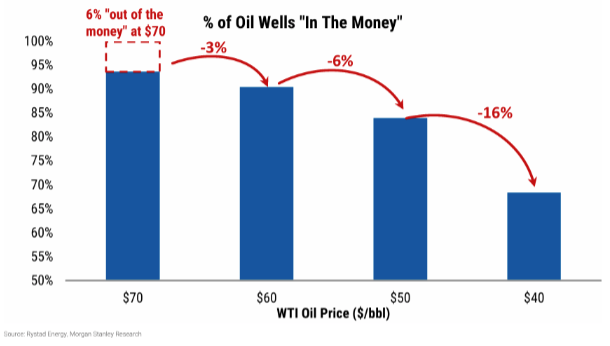
As the more wells fall below breakeven levels, producers react accordingly. The U.S. oil rig count has already shown some declines, currently at 461 down from 483 at the end of April. This creates a feedback effect on associated gas production.
One bank estimates that a WTI price of $50/barrel would cause associated gas supply to be flat to down over the same time period. With WTI at $40/barrel, declines in associated gas production could reach as much as 1 bcf/day. With natural gas demand expected to increase whether through increased consumption by the AI sector or higher LNG export demand, any reduction in supply will likely manifest in stronger Henry Hub prices.
Supply/Demand Balances
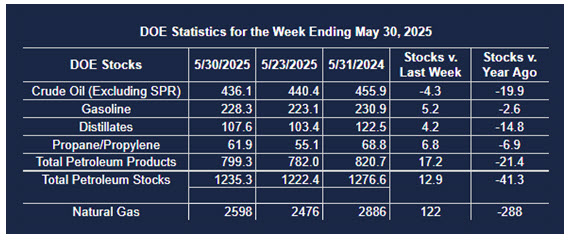
Supply/demand data in the United States for the week ending May 30, 2025, were released by the Energy Information Administration.
Total commercial stocks of petroleum increased (⬆) 12.9 million barrels to 1.2353 billion barrels during the week ending May 30th, 2025.
Commercial crude oil supplies in the United States were lower (⬇) by 4.3 million barrels from the previous report week to 436.1 million barrels.
Crude oil inventory changes by PAD District:
PADD 1: Down (⬇) 0.5 million barrels to 8.2 million barrels
PADD 2: Up (⬆) 0.2 million barrels to 107.5 million barrels
PADD 3: Down (⬇) 3.1 million barrels to 245.1 million barrels
PADD 4: Unchanged (=) at 24.8 million barrels
PADD 5: Down (⬇) 0.8 million barrels to 50.4 million barrels
Cushing, Oklahoma, inventories were up (⬆) 0.6 million barrels to 24.1 million barrels.
Domestic crude oil production increased (⬆) 7,000 barrels per day from the previous report at 13.408 million barrels per day.
Crude oil imports averaged 6.346 million barrels per day, a daily decrease (⬇) of 5,000 barrels. Exports decreased (⬇) 394,000 barrels daily to 3.907 million barrels per day.
Refineries used 93.4 percent of capacity; an increase (⬆) of 3.2 percent from the previous report week.
Crude oil inputs to refineries increased (⬆) 670,000 barrels daily; there were 16.998 million barrels per day of crude oil run to facilities. Gross inputs, which include blending stocks, increased (⬆) 592,000 barrels daily to 17.192 million barrels daily.
Total petroleum product inventories increased (⬆) by 17.2 million barrels from the previous report week, up to 799.2 million barrels.
Total product demand decreased (⬇) 714,000 barrels daily to 19.528 million barrels per day.
Gasoline stocks increased (⬆) 2.4 million barrels from the previous report week; total stocks are 228.3 million barrels.
Demand for gasoline decreased (⬇) 1,189,000 barrels per day to 8.263 million barrels per day.
Distillate fuel oil stocks increased (⬆) 4.2 million barrels from the previous report week; distillate stocks are at 107.6 million barrels. EIA reported national distillate demand at 3.151 million barrels per day during the report week, a decrease (⬇) of 741,000 barrels daily.
Propane stocks rose (⬆) 6.8 million barrels from the previous report to 61.9 million barrels. The report estimated current demand at 788,000 barrels per day, an increase (⬆) of 302,000 barrels daily from the previous report week.
Natural Gas
U.S. dry gas production averaged 105.7 bcf/d in May. 2025 supply growth is estimated at roughly 3.4 bcf/day, year-over-year. This pales before expected incremental demand of 5.8 bcf/day, year-over year.
The three-year period of limited growth in LNG feedgas demand is likely to come to an end as the next wave of export capacity starts to come online.

According to the EIA:
Net injections into storage totaled 122 Bcf for the week ending May 30, compared with the five-year (2020–24) average net injections of 98 Bcf and last year’s net injections of 94 Bcf during the same week. Working natural gas stocks totaled 2,598 Bcf, which is 117 Bcf (5%) more than the five-year average and 288 Bcf (10%) lower than last year at this time.
According to The Desk survey of natural gas analysts, estimates of the weekly net change to working natural gas stocks ranged from net injections of 108 Bcf to 130 Bcf, with a median estimate of 120 Bcf.
The average rate of injections into storage is 29% higher than the five-year average so far in the refill season (April through October). If the rate of injections into storage matched the five-year average of 8.3 Bcf/d for the remainder of the refill season, the total inventory would be 3,870 Bcf on October 31, which is 117 Bcf higher than the five-year average of 3,753 Bcf for that time of year.
Was this helpful? We’d like your feedback.
Please respond to [email protected]
This material has been prepared by a sales or trading employee or agent of Powerhouse Brokers, LLC and is, or is in the nature of, a solicitation. This material is not a research report prepared by Powerhouse Brokers, LLC. By accepting this communication, you agree that you are an experienced user of the futures markets, capable of making independent trading decisions, and agree that you are not, and will not, rely solely on this communication in making trading decisions.
DISTRIBUTION IN SOME JURISDICTIONS MAY BE PROHIBITED OR RESTRICTED BY LAW. PERSONS IN POSSESSION OF THIS COMMUNICATION INDIRECTLY SHOULD INFORM THEMSELVES ABOUT AND OBSERVE ANY SUCH PROHIBITION OR RESTRICTIONS. TO THE EXTENT THAT YOU HAVE RECEIVED THIS COMMUNICATION INDIRECTLY AND SOLICITATIONS ARE PROHIBITED IN YOUR JURISDICTION WITHOUT REGISTRATION, THE MARKET COMMENTARY IN THIS COMMUNICATION SHOULD NOT BE CONSIDERED A SOLICITATION.
The risk of loss in trading futures and/or options is substantial and each investor and/or trader must consider whether this is a suitable investment. Past performance, whether actual or indicated by simulated historical tests of strategies, is not indicative of future results. Trading advice is based on information taken from trades and statistical services and other sources that Powerhouse Brokers, LLC believes are reliable. We do not guarantee that such information is accurate or complete and it should not be relied upon as such. Trading advice reflects our good faith judgment at a specific time and is subject to change without notice. There is no guarantee that the advice we give will result in profitable trades.
Copyright 2025 Powerhouse Brokers, LLC, All rights reserved