Oil Supply Uncertainties Are Clarifying
- OPEC+ extends production cuts
- IEA predicts falling demand
- U.S. becomes important policy maker
- Natural gas tests resistance at $2.40

The Matrix
Powerhouse outlined last week the unusually long list of uncertainties facing oil supply. We pointed to decisions to be made by OPEC+ about crude oil production. Now, there is some clarity. OPEC+ has agreed to extend its production cuts.
OPEC+ will continue to cut its production for nine more months. A period longer than had been expected. It points to the seriousness with which OPEC+ takes the challenge of North American crude oil output expansion and the possible growth of global demand. These OPEC+ cuts have been in place since early 2017.
Ironically, OPEC+ is complying with the agreement after years during which it seemed up to Saudi Arabia alone to deliver on less production. The group counts on lesser output from some members to claim compliance in the current environment.
Iran’s crude oil exports have fallen dramatically. The United States has withdrawn from the nuclear deal and imposed heavy constraints on Irani crude oil exports.
Venezuela, too, has suffered from sanctions imposed by the United States. Nonetheless, regime change appears to be faltering; Venezuela is producing less oil each month.
At the same time, the International Energy Agency is now predicting slower demand growth. Slower growth reflects an expected slowdown in European petrochemicals and uninteresting product demand in the U.S.
The OPEC+ agreement comes at a time of very active geopolitical uncertainty. The “plus” gives the group control over half of global production. And largest among the “plus” is Russia. Russia, because of its large production, now holds large sway over OPEC’s decisions.
Another irony of the current non-U.S. production arrangements is the impact of OPEC+ agreements on U.S. power in the petroleum world. High prices benefit not only OPEC+ but also their greatest competitors, the U.S. shale oil producers. Higher oil prices enable shale producers to compete for a larger slice of market share.
Supply/Demand Balances
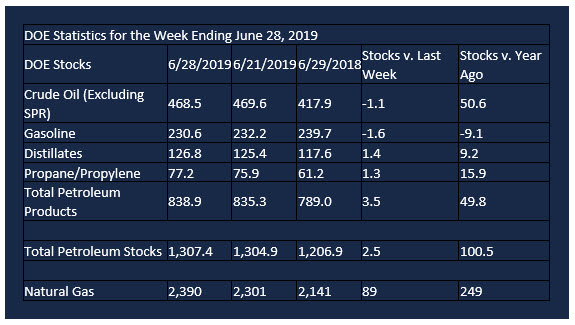
Supply/demand data in the United States for the week ending June 28, 2019, were released by the Energy Information Administration.
Total commercial stocks of petroleum rose 2.5 million barrels during the week ending June 28, 2019.
There were draws in stocks of gasoline, K-jet fuel, and residual fuel. There were builds in stocks of fuel ethanol, distillates, propane, and other oils.
Commercial crude oil supplies in the United States fell 1.1 million barrels from the previous report week to 468.5 million barrels.
Crude oil supplies decreased in four of the five PAD Districts. PAD District 2 (Midwest) stocks declined 0.4 million barrels, PADD 3 (Gulf Coast) stocks decreased 0.3 million barrels, PADD 4 (Rockies) stocks retreated 0.6 million barrels, and PADD 5 (West Coast) stocks experienced a draw of 1.5 million barrels. PADD 1 (East Coast) crude oil stocks increased 2.3 million barrels.
Cushing, Oklahoma inventories rose 0.7 million barrels from the previous report week to 52.5 million barrels.
Domestic crude oil production rose 100,000 barrels per day from the previous report week to 12.2 million barrels daily.
Crude oil imports averaged 7.585 million barrels per day, a daily increase of 929,000 barrels. Exports decreased 780,000 barrels daily to 2.990 million barrels per day.
Refineries used 94.2 percent of capacity, unchanged from the previous report week.
Crude oil inputs to refineries decreased 47,000 barrels daily; there were 17.290 million barrels per day of crude oil run to facilities. Gross inputs, which include blending stocks, rose 6,000 barrels daily to 17.718 million barrels daily.
Total petroleum product inventories rose 3.6 million barrels from the previous report week.
Gasoline stocks decreased 1.6 million barrels daily from the previous report week; total stocks are 230.6 million barrels.
Demand for gasoline rose 26,000 barrels per day to 9.492 million barrels per day.
Total product demand decreased 106,000 barrels daily to 20.770 million barrels per day.
Distillate fuel oil stocks increased 1.4 million barrels from the previous report week; distillate stocks are at 126.8 million barrels. EIA reported national distillate demand at 3.828 million barrels per day during the report week, a weekly decrease of 140,000 barrels daily.
Propane stocks increased 1.3 million barrels from the previous report week; propane stocks are 77.2 million barrels. The Report estimated current demand at 877,000 barrels per day, an increase of 9,000 barrels daily from the previous report week.
Natural Gas
According to the Energy Information Administration:
Net injections into storage totaled 98 Bcf for the week ending June 21, compared with the five-year (2014–18) average net injections of 70 Bcf and last year’s net injections of 71 Bcf during the same week. Working gas stocks totaled 2,301 Bcf, which is 171 Bcf lower than the five-year average and 236 Bcf more than last year at this time.
The average rate of net injections into storage is 39% higher than the five-year average so far in the refill season (April through October). If the rate of injections into storage matched the five-year average of 9.2 Bcf/d for the remainder of the refill season, total inventories would be 3,521 Bcf on October 31, which is 171 Bcf lower than the five-year average of 3,692 Bcf for that time of year.
A substantial rally in natural gas spot futures during the week ending July 5, 2019, reflected expectations for warmer weather in the eastern half of the country. Prices added 21 cents on the days surrounding July 4th. Resistance at $2.40 broke, introducing a new objective at $2.57 and then $2.70.
Futures trading involves significant risk and is not suitable for everyone. Transactions in securities futures, commodity and index futures and options on future markets carry a high degree of risk. The amount of initial margin is small relative to the value of the futures contract, meaning that transactions are heavily “leveraged”. A relatively small market movement will have a proportionately larger impact on the funds you have deposited or will have to deposit: this may work against you as well as for you. You may sustain a total loss of initial margin funds and any additional funds deposited with the clearing firm to maintain your position. If the market moves against your position or margin levels are increased, you may be called upon to pay substantial additional funds on short notice to maintain your position. If you fail to comply with a request for additional funds within the time prescribed, your position may be liquidated at a loss and you will be liable for any resulting deficit. Past performance may not be indicative of future results. This is not an offer to invest in any investment program.
Powerhouse is a registered affiliate of Coquest, Inc.
Was this helpful? We’d like your feedback.
Please respond to [email protected]
Copyright© 2019 Powerhouse, All rights reserved.