Bullish Oil Prospects Face Uncertainties
- New oil targets around $100 per barrel
- Refinery inputs rise
- Higher prices could invite political response
- LNG exports are flat in 2020

Alan Levine—Chairman, Powerhouse
(202) 333-5380
The Matrix
The first half of 2021 saw oil prices around the top of the year’s rally. OPEC+ was meeting to extend its agreement to increase crude oil output. This was a response to globally thin inventories while demand showed every sign of expanding. But growing disagreements with the United Arab Emirates over the base from which its quota was determined brought the meeting to a halt. No indication of a renewal of discussions has been made.
The UAE’s baseline has long been a matter of contention. UAE seeks to raise its baseline to 3.84 million barrels daily from 3.168 million barrels per day, established in the 2020 agreement. UAE could then add 672,000 barrels daily above its planned share of two million daily barrels by December for the entire OPEC+ group.
The news of the meeting’s ending moved prices higher. WTI crude oil reached $76.98. ULSD touched $2.21, and RBOB’s high was $2.33. Tight supplies in an expanding economy are consistent with generally bullish expectations.
Oil prices ended the first half of 2021 around recent highs. WTI reached $76.22 as the week of July 1, 2021, ended. ULSD reached its high, $2.1877, on June 23, and RBOB $2.3073 on July 2.
Producers of crude oil and refiners of petroleum products have become more bullish as daily price advances encourage more buying. As noted in last week’s Energy Market Situation, targets of $80 per barrel have been overtaken by $100 objectives.
Large crude oil producers are reportedly selling land throughout the Southwest. Cash in is intended for future activity as clean energy becomes the objective of oil operators. Analysts are expecting oil demand to return to pre-pandemic levels supporting new exploration.
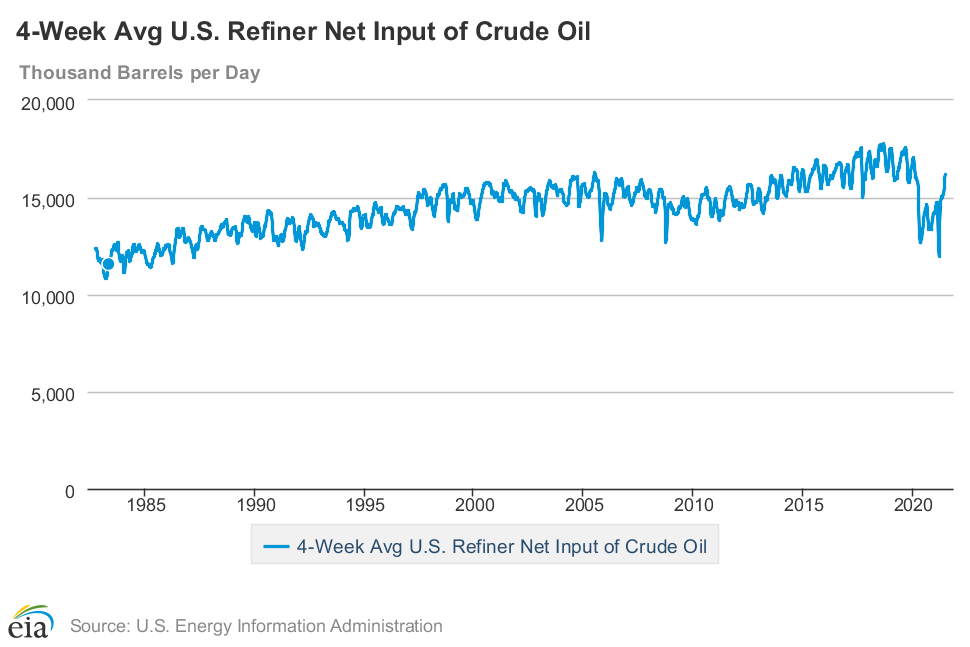
4-Week Avg. U.S. Refiner Net Input of Crude Oil Source: EIA
Refinery crude oil inputs have grown dramatically from the pandemic-induced 12 million barrels daily to 16.2 million barrels per day in late June 2021. Refinery utilization clocked in at 92.9% to support that figure. Concerns for short supply remain, with demand recording levels of 20.9 million barrels daily.
Demand should grow as the nation returns to regular business. But, as in most things economic, responses to high prices could be met with consumer resistance. Users could reduce demand or seek cheaper alternatives. One obvious choice could be smaller, fuel-efficient vehicles. And with hybrid and electric cars more readily available, they could add to market share at the expense of fossil fuels.
Politically, a crude oil price of, say, $85 per barrel, could invite policy responses disfavoring hydrocarbon fuels. One policy could be the imposition of tighter fuel efficiency requirements. Another policy could be economic benefits to specific kinds of vehicles.
The delta COVID-19 variant has proved to be especially virulent. It could become a barrier to further improvement in the COVID-19 situation. It could force the resumption of lockdown conditions and has had some of those reimposed already. While the market tenor is decidedly bullish, the delta danger remains, potentially slowing economic recovery.
Supply/Demand Balances
Supply/demand data in the United States for the week ended June 25, 2021, were released by the Energy Information Administration.
Total commercial stocks of petroleum fell 4.6 million barrels during the week ended June 25, 2021.
Total commercial stocks of petroleum fell 4.6 million barrels during the week ended June 25, 2021.
Commercial crude oil supplies in the United States decreased by 6.7 million barrels from the previous report week to 452.3 million barrels.
Crude oil inventory changes by PAD District:
PADD 1: Down 0.1 to 8.3 million barrels
PADD 2: Down 2.4 million barrels to 125.1 million barrels
PADD 3: Down 4.9 million barrels to 246.3 million barrels
PADD 4: Down 0.3 million barrels to 24.5 million barrels
PADD 5: Plus 1.0 million barrels to 48.2 million barrels
Cushing, Oklahoma, inventories were down 1.4 million barrels from the previous report week to 40.3 million barrels.
Domestic crude oil production was unchanged from the previous report week at 11.1 million barrels daily.
Crude oil imports averaged 6.406 million barrels per day, a daily decrease of 536,000 barrels. Exports increased 66,000 barrels daily to 3.717 million barrels per day.
Refineries used 92.7% of capacity; 0.7 percentage points lower from the previous report week.
Crude oil inputs to refineries increased 187,000 barrels daily; there were 16.299 million barrels per day of crude oil run to facilities. Gross inputs, which include blending stocks, rose 122,000 barrels daily to 16.800 million barrels daily.
Total petroleum product inventories rose 2.1 million barrels from the previous report week.
Gasoline stocks increased 1.5 million barrels from the previous report week; total stocks are 241.5 million barrels.
Demand for gasoline fell 267,000 barrels per day to 9.173 million barrels per day.
Total product demand increased 152,000 barrels daily to 20.902 million barrels per day.
Distillate fuel oil stocks fell 0.9 million barrels from the previous report week; distillate stocks are at 137.1 million barrels. EIA reported national distillate demand at 4.170 million barrels per day during the report week, an increase of 222,000 barrels daily.
Propane stocks rose 1.2 million barrels from the previous report week; propane stocks to 57.5 million barrels. The report estimated current demand at 993,000 million barrels per day, decrease of 20,000 barrels daily from the previous report week.
Natural Gas
Spot natural gas futures put in a $0.62 rally to end the second quarter of 2021. The price moved to $3.814 in seven consecutive up-days ending on June 30. Two days of lower daily high prices and higher low daily prices—inside days—added no further information on the direction of price.
Department of Energy reported that growth in global LNG trade was flat in 2020. This could be seen as bullish considering the pandemic that saw global demand for natural gas fall last year. “Between 2015 and 2019, global LNG trade expanded by 45%, posting record growth in 2018 and 2019. This expansion was primarily led by liquefaction capacity additions in Australia, the United States and Russia, which combined accounted for more than 90% of the global growth in liquefaction capacity during this period.”
A move above $3.81 opens the way to $4.92, the top of the market in November 2018. The market fell sharply after that, reaching $1.43 in June 2020. The recovery has recaptured more than 61.8% of the decline already.
According to the EIA:
The net injections into [natural gas] storage totaled 76 Bcf for the week ended June 25, compared with the five-year (2016–2020) average net injections of 65 Bcf and last year’s net injections of 73 Bcf during the same week. Working natural gas stocks totaled 2,558 Bcf, which is 143 Bcf lower than the five-year average and 510 Bcf lower than last year at this time.
The average rate of injections into storage is 13% lower than the five-year average so far in the refill season (April through October). If the rate of injections into storage matched the five-year average of 8.0 Bcf/d for the remainder of the refill season, the total inventory would be 3,576 Bcf on October 31, which is 143 Bcf lower than the five-year average of 3,719 Bcf for that time of year.
Was this helpful? We’d like your feedback.
Please respond to [email protected]
Powerhouse Futures & Trading Disclaimer
Copyright 2021 Powerhouse Brokerage, LLC, All rights reserved