U.S. Oil Futures Move Lower; Economic Outlook Unclear
- EIA petroleum balance data are again available
- Domestic oil inventories increase
- U.S. total petroleum demand is running hot
- LNG exports reached new high in 2021
Sincerely,
Alan Levine, Chairman
Powerhouse
(202) 333-5380
The Matrix
Prices for petroleum futures ended June on a down note. This may have reflected a bearish tone in the one-week delayed Department of Energy supply/demand balance for the week ended June 24.
Decision-making, absent current data on the condition of the markets, came under considerable pressure over the past two weeks.
Headline take-aways from the now-available US Petroleum Balance Sheet for the week ended June 24 show domestic inventories of principal oils increasing, following a period of significant tightness.
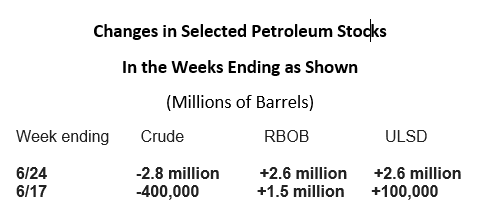
Inventories of RBOB and ULSD grew substantially over these weeks. Crude oil stocks fell at the same time. The improvement in product supply has been reflected in spot futures prices moving lower as July begins. Crude oil futures responded with a small rally; no new highs occurred.
The impact on ULSD availability can be seen in the chart of Days’ Supply.

Distillate Days of Supply – 5-year Trend Source: EIA, POWERHOUSE
EIA data show 30.6 days of ULSD inventory available in the United States. (RBOB is reported at 24.8 days.) These data are by no means comfortable, but they are at least back in the historical range of oil in stock.
Crude oil’s supply depletion should not be surprising. EIA reported national refinery use at 95% of capacity. Powerhouse has noted that this level is essentially unsustainable. Nonetheless, running at current levels has helped the country’s supply improve.
Nearby gasoline crack spreads have fallen. The gas crack spread topped at $59.72 a month ago. The spot spread is now around $46.46. Similarly, spot ULSD spot futures cracks are now at $57.00. They topped at $75.66 in June.
Caution remains the watchword for oil prices moving forward. Despite price easing in recent weeks, oil demand is still red hot. EIA’s data show demand brushing up against 20 million barrels daily for the most recent week. Demand year-to-date is 20.4 million barrels per day. Last year, the economy used 19.5 million daily barrels of petroleum products.
Crude oil production has just broken to 12.1 million barrels per day. And with uncertainty surrounding the direction of the economy, price direction is problematic going into the second half of the year.
Supply/Demand Balances
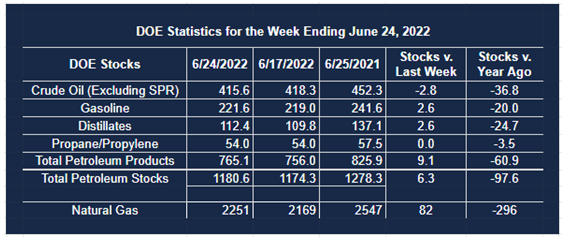
Supply/demand data in the United States for the week ended June 24, 2022, were released by the Energy Information Administration.
Total commercial stocks of petroleum grew 6.3 million barrels during the week ended June 24, 2022.
Commercial crude oil supplies in the United States decreased by 2.8 million barrels from the previous report week to 415.6 million barrels.
Crude oil inventory changes by PAD District:
PADD 1: Plus 0.1 million barrels to 7.6 million barrels
PADD 2: Minus 1.2 million barrels to 100.9 million barrels
PADD 3: Minus 0.8 million barrels to 236.2 million barrels
PADD 4: Minus 0.7 million barrels to 23.6 million barrels
PADD 5: Minus 0.1 million barrels to 47.2 million barrels
Cushing, Oklahoma, inventories were down 0.7 million barrels from the previous report week to 21.3 million barrels.
Domestic crude oil production was up 100,000 barrels from the previous report week to 12.1 million barrels daily.
Crude oil imports averaged 5.998 million barrels per day, a daily decrease of 228,000 barrels. Exports decreased 192,000 barrels daily to 3.380 million barrels per day.
Refineries used 95% of capacity; 1 percentage points higher than the previous report week.
Crude oil inputs to refineries increased 403,000 barrels daily; there were 16.666 million barrels per day of crude oil run to facilities. Gross inputs, which include blending stocks, rose 184,000 barrels daily to 16.809 million barrels daily.
Total petroleum product inventories added 9.1 million barrels from the previous report week, rising to 765 million barrels.
Total product demand increased 93,000 thousand barrels daily to 19.997 million barrels per day.
Gasoline stocks increased 2.6 million barrels from the previous report week; total stocks are 221.6 million barrels.
Demand for gasoline rose 417,000 barrels per day to 8.922 million barrels per day.
Distillate fuel oil stocks increased 2.6 million barrels from the previous report week; distillate stocks are at 112.4 million barrels. EIA reported national distillate demand at 3.568 million barrels per day during the report week, a decrease of 294,000 barrels daily.
Propane stocks were unchanged from the previous report week at 54 million barrels. The report estimated current demand at 1.116 million barrels per day, an increase of 321,000 barrels daily from the previous report week.
Natural Gas
Global trade in LNG reached a new high last year. Trade fell flat in 2020, reflecting the effects of the pandemic. Global activity resumed in 2021, advancing by 4.5% year-on-year, a growth of 2.2 Bcf/d. In all, 49 Bcf/d of LNG moved in international trade. Demand recovery and new export capacity combined to advance the LNG trade.
The gains in global trade have come about because of dramatic expansions of export capacity. EIA says global capacity has increased nearly 30% since 2017, 14 Bcf/d. The United States has had far and away the largest increases in that period, some 9.6 Bcf/d. Australia, +2.2 Bcf/d, and Russia, +1.7 Bcf/d lagged behind.
LNG exports followed. The US added 2.9 Bcf/d to LNG outflows in 2021. Australia, however, while adding only 0.1 Bcf/d to 2021 exports, remained the largest LNG exporters for the second year in a row.
LNG imports focused on Asia and Latin America, the only regions to record gains during 2021. Asian supplies grew 2.4 Bcf/d last year, most of which came to China, (+1.4 Bcf/d.)
Latin America added 0.6 Bcf/d from imports of LNG in 2021. Brazil took almost all of the increase. The worst drought in 90 years cut deeply into hydro generation, adding to the need for natural gas for electric power.
Hopes for additional supply from the US to global needs must now be tempered. The Freeport LNG accident has uncovered unsafe conditions at the site. This finding and a bearish natural gas storage report brought natural gas prices down to $5.24 as June trading ended. (Natural gas from renewable sources were also cited for bearish price results.) Some technicians think prices could now fall as low as $4.07.

According to the EIA:
Net [natural gas] injections into storage totaled 82 Bcf for the week ended June 24, compared with the five-year (2017–2021) average net injections of 73 Bcf and last year’s net injections of 73 Bcf during the same week. Working natural gas stocks totaled 2,251 Bcf, which is 322 Bcf lower than the five-year average and 296 Bcf lower than last year at this time.
The average rate of injections into storage is 5% lower than the five-year average so far in the refill season (April through October). If the rate of injections into storage matched the five-year average of 8.3 Bcf/d for the remainder of the refill season, the total inventory would be 3,323 Bcf on October 31, which is 322 Bcf lower than the five-year average of 3,645 Bcf for that time of year.
Was this helpful? We’d like your feedback.
Please respond to [email protected]
Powerhouse Futures & Trading Disclaimer
Copyright 2022 Powerhouse Brokerage, LLC, All rights reserved