Propane Gets the Gold for the Price High Jump
- Propane prices have resisted a summer sell-off, so far
- Global NGL supply and demand patterns have shifted with the pandemic
- Propane inventories are historically low
- Natural gas prices move above $4 on continued hot summer temperatures

Alan Levine—Chairman, Powerhouse
(202) 333-5380
The Matrix
Tennis star Naomi Osaka kicked off the delayed 2020 Tokyo Summer Olympics by lighting the Olympic cauldron. The flame, symbolic of the connection between the ancient games and our modern-day Olympics, will burn for over two weeks through the closing ceremony. The fuel used to keep the flame blazing is propane. According to Bruce Swiecicki, a senior adviser to the U.S. National Propane Gas Association, a cauldron of Olympic size would consume roughly 11 gallons of propane per hour, or 4,200 gallons for the time it will be lit for the summer games. By delaying a year, Tokyo’s propane bill more than doubled. The rise in price of propane looks to continue well after the flame is extinguished.
July is typically a good month to procure propane. Inventories should increase this time of year as demand wanes and producers maximize output. This year is different. Usual sources of NGL production are reduced. People around the world stayed home and cooked and grilled more than before. New demand emerged for outdoor heaters and single-use plastics (for example, disposable masks are made of plastic), and there is historic global thirst for U.S. propane. All of which conspired to move prices higher, at a time when many propane hedgers plan to buy a summer dip that so far has been elusive.
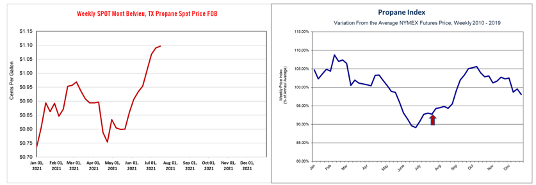
Propane Prices 2021 vs Average Year Source: Powerhouse, NYMEX
The chart on the left is the spot price of Mont Belvieu propane so far this year. The red arrow on the left-hand chart indicates where we usually are in the seasonal pattern.
Propane is produced from two sources: drilling and refining. The lion’s share of U.S. supply is produced as a byproduct of oil and gas drilling. As noted last week, shale producers have not responded to higher prices with increased drilling activity. European buyers rely on refining to supply their market, as there is minimal production locally. Refiners everywhere slashed production during the global pandemic, or even permanently closed.
Demand from Asia has continued to grow as economies have recovered, and the need for petrochemical feedstocks remains strong. Capacity expanded at export facilities in the Gulf, allowing for the outflow of U.S. propane in record amounts and making the nation the world’s top exporter.
U.S. propane inventories are low compared to historical averages. Propane stocks grew 3.1 million barrels during the week ended July 16, more than anticipated. Yet prices did not move lower on the news. Looking ahead, the grain drying season and winter heating demand are not that far away. Grain drying demand could be strong this year. Corn crops are ahead of schedule in many parts of the country, and the price per bushel is high. The combination may lead to an early harvest, with farmers not risking leaving corn in the fields to dry. High grain prices leave room in the budget for early grain drying. Low inventories leave prices vulnerable if cold weather materializes this winter.
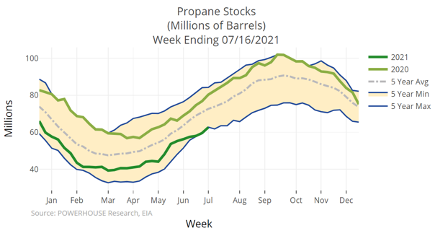
Propane Stocks 5-year Trend Chart Source: Powerhouse, EIA
If you still need to buy propane and are reluctant to lock in a price at these levels, there is an alternative. Options are available on propane indexed to both Mont Belvieu and Conway. Think of an option as an insurance policy against prices getting more expensive but with the flexibility to participate in lower prices if the market ultimately falls. Please get in touch with Powerhouse at [email protected] to learn more.
The Winter Olympics start in February 2022. Beijing should be planning now for the next Olympic flame.
Supply/Demand Balances
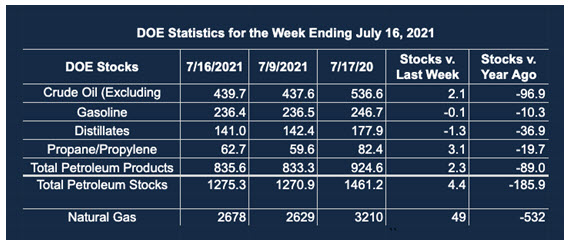
Supply/demand data in the United States for the week ended July 16, 2021, were released by the Energy Information Administration.
Total commercial stocks of petroleum rose 4.4 million barrels during the week ended July 16, 2021.
Commercial crude oil supplies in the United States increased by 2.1 million barrels from the previous report week to 439.7 million barrels.
Crude oil inventory changes by PAD District:
PADD 1: Plus 0.3 to 8.9 million barrels
PADD 2: Down 2.3 million barrels to 119 million barrels
PADD 3: Plus 1.9 million barrels to 238.4 million barrels
PADD 4: Plus 0.3 million barrels to million barrels
PADD 5: Plus 1.8 million barrels to 49.1 million barrels
Cushing, Oklahoma, inventories were down 1.4 million barrels from the previous report week to 36.7 million barrels.
Domestic crude oil production was unchanged from the previous report week at 11.4 million barrels daily.
Crude oil imports averaged 7.097 million barrels per day, a daily increase of 875,000 barrels. Exports decreased 1.562 million barrels daily to 2.463 million barrels per day.
Refineries used 91.4% of capacity; 0.4 percentage points lower from the previous report week.
Crude oil inputs to refineries decreased 86,000 barrels daily; there were 16.007 million barrels per day of crude oil run to facilities. Gross inputs, which include blending stocks, fell 74,000 barrels daily to 16.569 million barrels daily.
Total petroleum product inventories rose 2.3 million barrels from the previous report week.
Gasoline stocks decreased 0.1 million barrels from the previous report week; total stocks are 236.4 million barrels.
Demand for gasoline rose 12,000 barrels per day to 9.295 million barrels per day.
Total product demand increased 1.278 million barrels daily to 20.581 million barrels per day.
Distillate fuel oil stocks fell 1.3 million barrels from the previous report week; distillate stocks are at 141 million barrels. EIA reported national distillate demand at 3.925 million barrels per day during the report week, an increase of 761,000 barrels daily.
Propane stocks rose 3.1 million barrels from the previous report week to 62.7 million barrels. The report estimated current demand at 784,000 barrels per day, a decrease of 332,000 barrels daily from the previous report week.
Natural Gas
Natural gas prices vaulted over resistance at $3.822, settling the week above $4 for the first time since December 2018. Traders shrugged off a larger than expected 49 Bcf injection, instead focusing on the next round heat impacting most of the lower 48 states. Higher than normal temperatures are expected to begin in Pacific Northwest, and by mid-week, the heat dome should stretch from the West coast to the Appalachians. The next resistance point is $4.666.
According to the EIA:
Working gas in storage was 2,678 Bcf as of Friday, July 16, 2021, according to EIA estimates. This represents a net increase of 49 Bcf from the previous week. Stocks were 532 Bcf less than the year-ago perid and 176 Bcf below the five-year average of 2,854 Bcf. At 2,678 Bcf, total working gas is within the five-year historical range.
Was this helpful? We’d like your feedback.
Please respond to [email protected]
Powerhouse Futures & Trading Disclaimer
Copyright 2021 Powerhouse Brokerage, LLC, All rights reserved