Loss of Crude Oil Supply Raising Prices
- Global tensions raise worry about supply availability
- Canada losing 350,00 barrels daily of tar sands
- Distillate fuel oil especially threatened
- Long-term view of global natural gas demand bullish

The Matrix
Oil prices are moving toward recent highs as the second half of 2018 opens. This is despite the success of American shale oil production approaching eleven million barrels daily. Complacency held prices in a price band between $65.00 and $72.00 and reduced U.S. concerns for supply.
Oil has always been sensitive to geopolitical forces. And after a period of quiet, international tensions, increases in mandated uses of distillate fuel oils and growth in global demand have reasserted worries about the adequacy of supply, especially distillate fuel oil, going into this winter.
Interference with supply has appeared in several places. Canadian syncrude, for example, has shut down because of power shortages. This is likely to cause the loss of up to 350,000 barrels daily of tar sands through much of the summer.
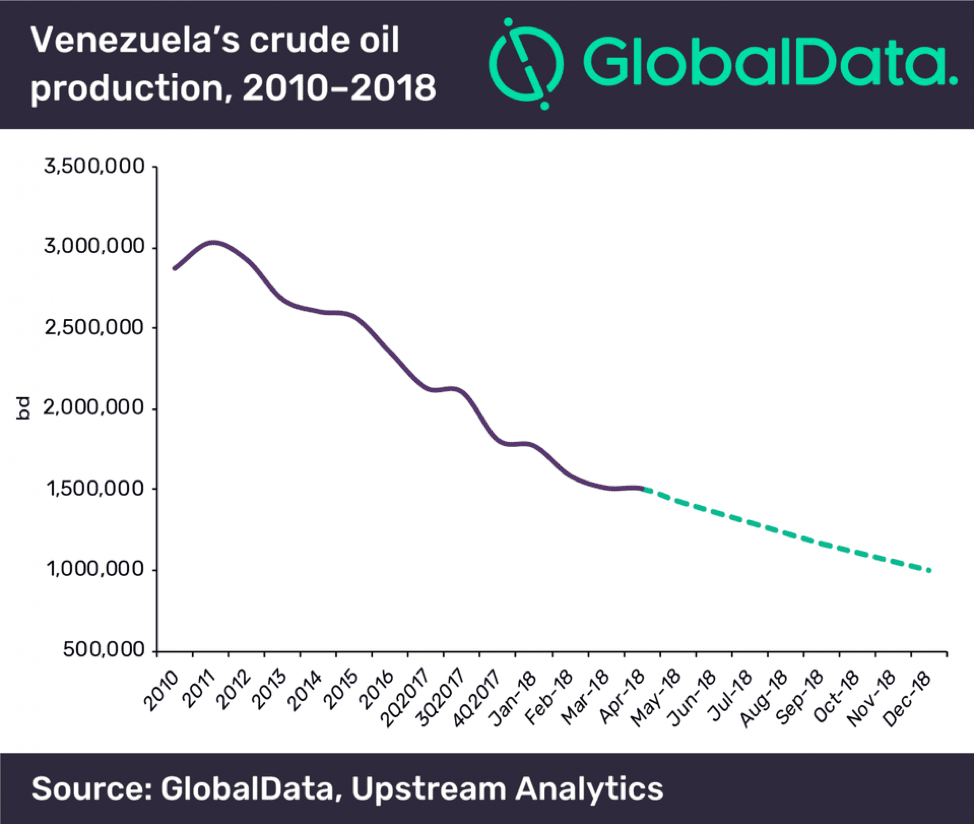
More troublesome, perhaps, is the potential for lost production in Venezuela. Press reports note that Venezuela advised eight international customers that the country would not be able to meet its June commitments. PDVSA has committed to supply 1.5 million barrels daily to these customers; it has less than 700,000 barrels per day available for export.
The withdrawal from the nuclear deal with Iran, the Joint Comprehensive Plan of Action (JCPOA,) by the United States could have even greater effects on supply. Currently, Iran exports 2.5 million barrels per day. Much of this goes to American allies on which the Trump administration is exerting great pressure to halt imports from Iran. Estimates of lost exports run to about 500,000 barrels daily.
International affairs are in a state of uncertainty that extends beyond effects on crude oil supply. Most significant is escalating tension with China. Tariffs, blocks on investment and research are possibilities, but there is some suggestion that conflicts may ultimately fall short of an all-out trade war. Issues with North Korea, Russia and even our own traditional allies add to the uncertainty.
It is not clear what the net of these considerations might do to oil prices but the loss of supply is clearly bullish.
Supply/Demand Balances
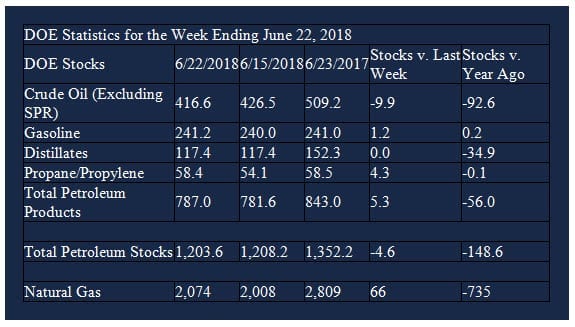
Supply/demand data in the United States for the week ending June 22, 2018 were released by the Energy Information Administration.
Total commercial stocks of petroleum fell 4.6 million barrels during the week ending June 22, 2018.
There were builds in stocks of gasoline, K-jet fuel, propane, and other oils. There was a draw in stocks of residual fuel oil. Fuel ethanol and distillate fuel oil stocks were unchanged from the previous report week.
Commercial crude oil supplies in the United States decreased to 416.6 million barrels, a draw of 9.9 million barrels.
Crude oil supplies decreased in four of the five PAD Districts. PAD District 2 (Midwest) stocks declined 3.7 million barrels, PADD 3 (Gulf Coast) crude oil stocks decreased 5.2 million barrels, PADD 4 (Rockies) stocks fell 0.3 million barrels, and PADD 5 (West Coast) stocks retreated 2.4 million barrels.
Cushing, Oklahoma inventories decreased 2.7 million barrels from the previous report week to 29.9 million barrels.
Domestic crude oil production was unchanged from the previous report week at 10.900 million barrels per day.
Crude oil imports averaged 8.356 million barrels per day, a daily increase of 114,000 barrels per day. Exports increased 626,000 barrels daily to 3.000 million barrels per day.
Refineries used 97.5 per cent of capacity, an increase of 0.8 percentage points from the previous report week.
Crude oil inputs to refineries increased 115,000 barrels daily; there were 17.816 million barrels per day of crude oil run to facilities.
Gross inputs, which include blending stocks, rose 141,000 barrels daily to 18.124 million barrels daily.
Total petroleum product inventories saw an increase of 5.3 million barrels from the previous report week.
Gasoline stocks increased 1.2 million barrels from the previous report week; total stocks are 241.2 million barrels.
Demand for gasoline rose 406,000 barrels per day to 9.731 million barrels per day.
Total product demand increased 67,000 barrels daily to 20.295 million barrels per day.
Distillate fuel oil stocks were unchanged from the previous report week at 117.4 million barrels. National distillate demand was reported at 3.612 million barrels per day during the report week. This was a weekly decrease of 213,000 barrels daily.
Propane stocks rose 4.3 million barrels from the previous report week; propane stock are 58.4 million barrels. Current demand is estimated at 827,000 barrels per day, an increase of 279,000 barrels daily from the previous report week.
Natural Gas
According to the Energy Information Administration:
Net injections [of natural gas] fell below the five-year average. Net injections into storage totaled 66 Bcf for the week ending June 22, compared with the five-year (2013–17) average net injection of 72 Bcf and last year’s net injections of 48 Bcf during the same week.
Net injections averaged 9.6 Bcf/d and will have to average 13.3 Bcf/d for the remainder of the refill season to match the five-year average level (3,815 Bcf) by October 31. Working gas stocks totaled 2,074 Bcf, which is 501 Bcf lower than the five-year average and 735 Bcf lower than last year at this time.
The long-term outlook for natural gas demand has been the subject of intense analysis, especially as energy analysts are looking for a post-hydrocarbon energy world. One study released at the World Gas Conference projects global natural gas consumption rising under almost any scenario, including rapid transition to low-carbon circumstances. These forecasts see natural gas overtaking coal as the second greatest source of energy usage by 2035. Only oil will account for more. New demand is likely to come from non-OECD areas.
Futures trading involves significant risk and is not suitable for everyone. Transactions in securities futures, commodity and index futures and options on future markets carry a high degree of risk. The amount of initial margin is small relative to the value of the futures contract, meaning that transactions are heavily “leveraged”. A relatively small market movement will have a proportionately larger impact on the funds you have deposited or will have to deposit: this may work against you as well as for you. You may sustain a total loss of initial margin funds and any additional funds deposited with the clearing firm to maintain your position. If the market moves against your position or margin levels are increased, you may be called upon to pay substantial additional funds on short notice to maintain your position. If you fail to comply with a request for additional funds within the time prescribed, your position may be liquidated at a loss and you will be liable for any resulting deficit. Past performance may not be indicative of future results. This is not an offer to invest in any investment program.
Powerhouse is a registered affiliate of Coquest, Inc.
Was this helpful? We’d like your feedback.
Please respond to [email protected]
Copyright © 2018 Powerhouse, All rights reserved.