Oil Markets Facing Contradictory Pressures
- U.S. – China trade talks are advancing
- Other uncertainties include Mexico and Iran
- U.S. stature as major oil player is growing
- Refinery growth reaches 18.8 million barrels daily
- Natural gas still seeking a price bottom

The Matrix
Oil markets are subject to an unusual range of impacts at mid-year. Trade talks between the United States and China have been very challenging to follow. The implications for future economic wellbeing cover a wide range of outcomes. At writing, a sort of truce has developed. Further escalation is, for now, on hold as negotiators seek a more permanent agreement.
Other potentials include Mexico’s challenge to strengthen border security. Japan and the EU must develop export restraints to avoid threats of U.S. auto tariffs. Even more problematic is the possibility of military action with Iran.
Expectations for traditional petroleum indicators are generally bullish. Global demand for petroleum is likely to grow modestly. The challenge of refining lighter United States’ crude oils has to adapt to difficulties in getting heavier Venezuelan stocks. The position of the U.S. as a major exporter will normalize as barriers to domestic crude oil transportation are overcome.
The development of the United States as a leading crude oil producer and a major exporter of both crude oil and petroleum products has had important ramifications for refining.
U.S. crude oil distillation capacity reached a record 18.8 million barrels per day at the beginning of 2019. The previous high was reached in 1981 when the U.S. had 18.6 million barrels daily of distillation capacity.
Expansion of capacity resulted in record levels of 2018 refinery runs. Inputs to refineries averaged 17.0 million barrels daily. By comparison, runs were 14.3 million barrels per day in 2009, when the expansion of domestic production began.
Changes in sources and uses of petroleum affected imports and exports too. Imports have decreased since 2009, falling 1.3 million barrels daily. Exports have grown 2.0 million barrels per day during that period. Net imports fell to 5.8 million daily barrels in 2018. In 2009, net imports were 9.0 million barrels.
The implications of domestic self-sufficiency are important for national economic and defense security.
Supply/Demand Balances
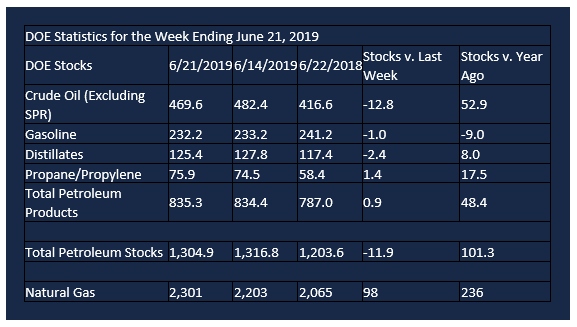
Supply/demand data in the United States for the week ending June 21, 2019, were released by the Energy Information Administration.
Total commercial stocks of petroleum fell 11.9 million barrels during the week ending June 21, 2019.
There were draws in stocks of gasoline, K-jet fuel, distillates, and residual fuel. There were builds in stocks of propane and other oils. Stocks of fuel ethanol were unchanged from the previous report week.
Commercial crude oil supplies in the United States fell 12.8 million barrels from the previous report week to 469.6 million barrels.
Crude oil supplies decreased in all five PAD Districts. PADD 1 (East Coast) crude oil stocks fell 2.2 million barrels, PADD 2 (Midwest) stocks declined 2.4 million barrels, PADD 3 (Gulf Coast) stocks decreased 6.3 million barrels, PADD 4 (Rockies) stocks retreated 0.7 million barrels, and PADD 5 (West Coast) stocks experienced a draw of 1.2 million barrels.
Cushing, Oklahoma inventories declined 1.8 million barrels from the previous report week to 51.8 million barrels.
Domestic crude oil production fell 100,000 barrels per day from the previous report week to 12.1 million barrels daily.
Crude oil imports averaged 6.656 million barrels per day, a daily decrease of 812,000 barrels. Exports increased 348,000 barrels daily to 3.770 million barrels per day.
Refineries used 94.2 percent of capacity, an increase of 0.3 percentage points from the previous report week.
Crude oil inputs to refineries increased 73,000 barrels daily; there were 17.337 million barrels per day of crude oil run to facilities. Gross inputs, which include blending stocks, rose 43,000 barrels daily to 17.712 million barrels daily.
Total petroleum product inventories rose 1.1 million barrels from the previous report week.
Gasoline stocks decreased 1.0 million barrels daily from the previous report week; total stocks are 232.2 million barrels.
Demand for gasoline fell 462,000 barrels per day to 9.466 million barrels per day.
Total product demand increased 69,000 barrels daily to 20.876 million barrels per day.
Distillate fuel oil stocks decreased 2.4 million barrels from the previous report week; distillate stocks are at 125.4 million barrels. EIA reported national distillate demand at 3.968 million barrels per day during the report week, a weekly decrease of 93,000 barrels daily.
Propane stocks increased 1.4 million barrels from the previous report week; propane stocks are 75.9 million barrels. The Report estimated current demand at 867,000 barrels per day, an increase of 265,000 barrels daily from the previous report week.
Natural Gas
According to the Energy Information Administration:
Net injections into storage totaled 98 Bcf for the week ending June 21, compared with the five-year (2014–18) average net injections of 70 Bcf and last year’s net injections of 71 Bcf during the same week. Working gas stocks totaled 2,301 Bcf, which is 171 Bcf lower than the five-year average and 236 Bcf more than last year at this time.
The average rate of net injections into storage is 39% higher than the five-year average so far in the refill season (April through October). If the rate of injections into storage matched the five-year average of 9.2 Bcf/d for the remainder of the refill season, total inventories would be 3,521 Bcf on October 31, which is 171 Bcf lower than the five-year average of 3,692 Bcf.
Natural gas market analysts are looking for a price bottom to develop. Sentiment measures are turning more bullish. This is a minimum condition for a rally to develop. Cash prices in the Northeast are reportedly below Henry Hub levels, an indication of continuing weakness. Significant resistance has been put at $2.80.
Futures trading involves significant risk and is not suitable for everyone. Transactions in securities futures, commodity and index futures and options on future markets carry a high degree of risk. The amount of initial margin is small relative to the value of the futures contract, meaning that transactions are heavily “leveraged”. A relatively small market movement will have a proportionately larger impact on the funds you have deposited or will have to deposit: this may work against you as well as for you. You may sustain a total loss of initial margin funds and any additional funds deposited with the clearing firm to maintain your position. If the market moves against your position or margin levels are increased, you may be called upon to pay substantial additional funds on short notice to maintain your position. If you fail to comply with a request for additional funds within the time prescribed, your position may be liquidated at a loss and you will be liable for any resulting deficit. Past performance may not be indicative of future results. This is not an offer to invest in any investment program.
Powerhouse is a registered affiliate of Coquest, Inc.
Was this helpful? We’d like your feedback.
Please respond to [email protected]
Copyright© 2019 Powerhouse, All rights reserved.