OPEC+ Acts, Markets React
- OPEC+ boosts production quotas again
- Market reaction diverges from expectations
- OPEC+ supply decisions affect other producers
- Interesting natural gas arbitrage develops
Sincerely,
David Thompson, CMT
Executive Vice President
Powerhouse
(202) 333-5380
The Matrix
On Saturday, OPEC+ members agreed to increase their production allowances by 548,000 barrels per day (bpd). This fulfilled some earlier expectations for a ‘super- sized’ quota boost. With this quota increase and a now expected 500k+ bpd increase in September, the cartel will have reversed the entirety of its 2.2 million bpd voluntary cut announced in November, 2023. The oil markets responded early on Monday by rallying.
While it might be tempting to see an increase in price in the face of an increase in supply as a cruel joke played upon economics professors everywhere, it reflects the fact that market process multiple factors simultaneously. OPEC+, and specifically Saudi Arabia, produces crude oil at lower costs than most other nations. As they bring more of these lower cost barrels to market they put financial pressure on US shale producers. In the most recent Q2 survey by the Dallas Federal Reserve Bank, nearly 50% of oil company executives expect to drill fewer wells in 2025 than they planned at the beginning of the year and 25% expect to drill significantly fewer wells.
Turning to the demand side of the equation, three supportive factors are now in play. The continued weakness in the US dollar allows foreign buyers of crude to purchase more barrels for the same amount of their local currency. Additionally, Goldman Sachs sees some evidence of increasing Chinese oil demand. Lastly, strong crack spreads in the US are incentivizing refiners to run at above-average levels.
Headlines are designed to grab attention. POWERHOUSE will always drill deeper to deliver a more complete picture to our readers.
Supply/Demand Balances
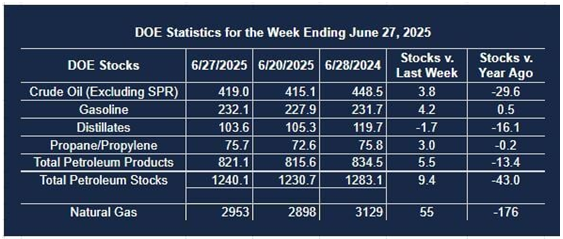
Supply/demand data in the United States for the week ended June 27, 2025, were released by the Energy Information Administration.
Total commercial stocks of petroleum increased (⬆) 9.4 million barrels to 1.2401 billion barrels during the week ended June 27th, 2025.
Commercial crude oil supplies in the United States were higher (⬆) by 3.8 million barrels from the previous report week to 419.0 million barrels.
Crude oil inventory changes by PAD District:
PADD 1: Down (⬇) 0.2 million barrels to 8.9 million barrels
PADD 2: Up (⬆) 0.7 million barrels to 103.0 million barrels
PADD 3: Up (⬆) 5.0 million barrels to 234.9 million barrels
PADD 4: Down (⬇) 0.4 million barrels to 23.4 million barrels
PADD 5: Down (⬇) 1.3 million barrels to 48.7 million barrels
Cushing, Oklahoma, inventories were down (⬇) 1.5 million barrels to 20.7 million barrels.
Domestic crude oil production decreased (⬇) 2,000 barrels per day from the previous report at 13.433 million barrels per day.
Crude oil imports averaged 5.919 million barrels per day, a daily increase (⬆) of 976,000 barrels. Exports decreased (⬇) 1,965,000 barrels daily to 2.305 million barrels per day.
Refineries used 94.9% of capacity; an increase (⬆) of 0.2% from the previous report week.
Crude oil inputs to refineries increased (⬆) 118,000 barrels daily; there were 17.105 million barrels per day of crude oil run to facilities. Gross inputs, which include blending stocks, increased (⬆) 36,000 barrels daily to 17.235 million barrels daily.
Total petroleum product inventories increased (⬆) by 5.5 million barrels from the previous report week, up to 821.1 million barrels.
Total product demand decreased (⬇) 27,000 barrels daily to 20.487 million barrels per day.
Gasoline stocks increased (⬆) 4.2 million barrels from the previous report week; total stocks are 232.1 million barrels.
Demand for gasoline decreased (⬇) 1,048,000 barrels per day to 8.640 million barrels per day.
Distillate fuel oil stocks decreased (⬇) 1.7 million barrels from the previous report week; distillate stocks are at 103.6 million barrels. EIA reported national distillate demand at 4.043 million barrels per day during the report week, an increase (⬆) of 249,000 barrels daily.
Propane stocks rose (⬆) 3.0 million barrels from the previous report to 75.7 million barrels. The report estimated current demand at 568,000 barrels per day, an increase (⬆) of 264,000 barrels daily from the previous report week.
Natural Gas
The last two months have seen choppy trading for natural gas futures. This bucks the normal seasonal strength seen as shoulder season ends and the market starts to price in higher summer demand. One dynamic contributing to the recent spell of rangebound trading may be the fact that next-day cash gas prices at Henry Hub have been lower than the front-month futures contract since late April. As long as market participants can cover their trading costs, they are incented to lock in an arbitrage profit from buying spot gas, storing it and selling a futures contract.
Feedgas demand at The Big 8 US LNG export facilities is starting to ramp back up as maintenance and outages are receding. Analysts estimate that so far in July 15.5 bcf/d has flowed into these units versus 14.3 in June.
According to the EIA:
- Net injections into storage totaled 96 Bcf for the week ended June 20, compared with the five-year (2020–24) average net injections of 79 Bcf and last year's net injections of 59 Bcf during the same week. Working natural gas stocks totaled 2,898 Bcf, which is 179 Bcf (7%) more than the five-year average and 196 Bcf (6%) lower than last year at this time.
- According to The Desk survey of natural gas analysts, estimates of the weekly net change to working natural gas stocks ranged from net injections of 80 Bcf to 102 Bcf, with a median estimate of 88 Bcf.
- The average rate of injections into storage is 28% higher than the five-year average so far in the refill season (April through October). If the rate of injections into storage matched the five-year average of 7.8 Bcf/d for the remainder of the refill season, the total inventory would be 3,932 Bcf on October 31, which is 179 Bcf higher than the five-year average of 3,753 Bcf for that time of year.
Was this helpful? We’d like your feedback.
Please respond to [email protected]
This material has been prepared by a sales or trading employee or agent of Powerhouse Brokers, LLC and is, or is in the nature of, a solicitation. This material is not a research report prepared by Powerhouse Brokers, LLC. By accepting this communication, you agree that you are an experienced user of the futures markets, capable of making independent trading decisions, and agree that you are not, and will not, rely solely on this communication in making trading decisions.
DISTRIBUTION IN SOME JURISDICTIONS MAY BE PROHIBITED OR RESTRICTED BY LAW. PERSONS IN POSSESSION OF THIS COMMUNICATION INDIRECTLY SHOULD INFORM THEMSELVES ABOUT AND OBSERVE ANY SUCH PROHIBITION OR RESTRICTIONS. TO THE EXTENT THAT YOU HAVE RECEIVED THIS COMMUNICATION INDIRECTLY AND SOLICITATIONS ARE PROHIBITED IN YOUR JURISDICTION WITHOUT REGISTRATION, THE MARKET COMMENTARY IN THIS COMMUNICATION SHOULD NOT BE CONSIDERED A SOLICITATION.
The risk of loss in trading futures and/or options is substantial and each investor and/or trader must consider whether this is a suitable investment. Past performance, whether actual or indicated by simulated historical tests of strategies, is not indicative of future results. Trading advice is based on information taken from trades and statistical services and other sources that Powerhouse Brokers, LLC believes are reliable. We do not guarantee that such information is accurate or complete and it should not be relied upon as such. Trading advice reflects our good faith judgment at a specific time and is subject to change without notice. There is no guarantee that the advice we give will result in profitable trades.
Copyright 2025 Powerhouse Brokers, LLC, All rights reserved