Conflicting Data Leave Oil Prices Searching for Direction
- Employment data supportive
- Large petroleum supply builds are bearish
- Distillate fuel oil stocks improving; still below average
- Cold weather outlook overrides natural gas storage situation
Sincerely,
Alan Levine, Chairman
Powerhouse
(202) 333-5380
The Matrix
Oil markets felt pressure from several factors last week. Economic data, ostensibly supportive for demand, were met with skepticism from market observers. Domestic inventories contained a few bearish surprises too.
Jobs data were supportive. The Bureau of Labor Statistics estimated 216,000 more positions were added in December. This was well ahead of expected gains of 175,000 jobs. Higher employment also invites inflation. And markets had been prepping for easing interest rates by the Federal Reserve bank. Concerns that such cuts could be delayed cast a pall on markets.
The Institute of Supply Management later reported that service sector employment was falling. This was in contradiction of the BLS data. The reports offset each other’s impact. Petroleum futures prices ended the week slightly higher than the previous week, with no important technical information to be had.
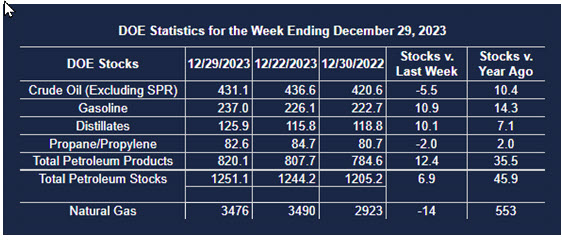
Domestic petroleum balances were released for the week ending December 29, 2023. These were generally seen as bearish. While crude oil in storage fell by 5.5 million barrels, supplies of gasoline and distillate fuel oil increased by more than ten million barrels each.
Gasoline stocks stood at 354.4 million barrels, a weekly gain of 10.9 million barrels. The increase was reported to be the largest weekly gain in over 30 years. Part of the gain can be attributed to a loss in demand of 1.214 million daily barrels to 7.954 million barrels daily. A drop in usage is not unusual for the week following Christmas. The impact on supply was complicated by a decline in refiners’ net production.
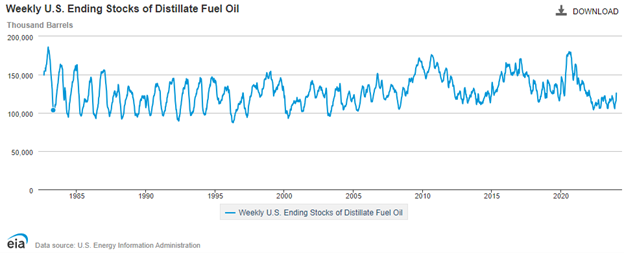
A similar (+10.1 million barrels daily) increase in distillate fuel oil storage was reported as well. And with supplies now at 125.9 million barrels, the deep concerns over supply last autumn appear to have been considerably eased.
Supply/Demand Balances
Supply/demand data in the United States for the week ending December 29, 2023, were released by the Energy Information Administration.
Total commercial stocks of petroleum rose (⬆) 6.9 million barrels to 1.2511 billion barrels during the week ending December 29, 2023.
Commercial crude oil supplies in the United States were lower (⬇) by 5.5 million barrels from the previous report week to 431.1 million barrels.
Crude oil inventory changes by PAD District:
PADD 1: Down (⬇) 1.0 million barrels to 7.1 million barrels
PADD 2: Down (⬇) 0.5 million barrels to 116.1 million barrels
PADD 3: Down (⬇) 3.0 million barrels to 234.7 million barrels
PADD 4: Down (⬇) 0.2 million barrels to 25.5 million barrels
PADD 5: Down (⬇) 0.8 million barrels to 47.7 million barrels
Cushing, Oklahoma inventories were up (⬆) 0.7 million barrels from the previous report week to 34.7 million barrels.
Domestic crude oil production was lower (⬇) 100,000 barrels at 13.2 million barrels daily.
Crude oil imports averaged 6.895 million barrels per day, a daily increase (⬆) of 619,000 barrels. Exports increased (⬆) 1.377 million barrels daily to 5.292 million barrels per day.
Refineries used 93.5 percent of capacity; 0.2 percentage points higher (⬆) than the previous report week.
Crude oil inputs to refineries increased (⬆) 121,000 barrels daily; there were 16.679 million barrels per day of crude oil run to facilities. Gross inputs, which include blending stocks, increased (⬆) 31,000 barrels daily to 17.082 million barrels daily.
Total petroleum product inventories increased (⬆) by 12.4 million barrels from the previous report week, up to 820.0 million barrels.
Total product demand decreased (⬇) 2.356 million barrels daily to 19.059 million barrels per day.
Gasoline stocks increased (⬆) 10.9 million barrels from the previous report week; total stocks are 237.0 million barrels.
Demand for gasoline decreased (⬇) 1.214 million barrels per day to 7.954 million barrels per day.
Distillate fuel oil stocks increased (⬆) 10.1 million barrels from the previous report week; distillate stocks are at 125.9 million barrels. EIA reported national distillate demand at 2.658 million barrels per day during the report week, a decrease (⬇) of 1.318 million barrels daily.
Propane stocks decreased (⬇) by 2.0 million barrels from the previous report week to 82.6 million barrels. The report estimated current demand at 1.358 million barrels per day, a decrease (⬇) of 39,000 barrels daily from the previous report week.
Natural Gas
The week ending December 30 failed to produce meaningful Heating Degree Days. NOAA’s Climate Prediction Center (CPC) reported 54 few HDDs than normal during the week for the nation, and cumulatively 250 HDDs less than normal for the fiscal year to date. Comparisons with last year were little different.
Nonetheless, prices for natural gas moved higher every day last week. In fact, the rally has now been in force since December 11. Spot futures prices settled at $2.893, a weekly increase of about $0.38, Nearly $0.61 have been gained since the rally began.
As noted last week by Powerhouse, expectations of colder weather in the new year are now in the driver’s seat. An unravelling of the Polar Vortex could bring significant amounts of Arctic cold into the eastern third of the country.

The rally could continue, given these weather expectations, but the storage situation weighs on a further sustained advance in price. (Major resistance at $3.63 remains far away. Support can be found at $2.412).
Department of Energy data for the week ending December 20, 2023, show a strong supply situation. Marketed production of natural gas for the week was 119.9 Bcf/d compared with last year at 114.6 Bcf/d.

Production of dry gas was 105.8 Bcf/d for the week. Last year, output was 101.6. This is especially interesting because of the poor HDD showing to date.
Consumption, of course, has taken a hit. Most of this was in the Residential/commercial sector, where demand fell to 35.9 Bcf/d for the week ending December 20, compared with 44.9 Bcf/d for same week last year. Demand in the Power and Industrial sectors was largely unchanged.
Exports to Mexico increased almost one Bcf/d to 6.2 Bcf/d year-on-year for the week.

The chart of exports to Mexico shows the growing importance of sales to this country.
Was this helpful? We’d like your feedback.
Please respond to [email protected]
This material has been prepared by a sales or trading employee or agent of Powerhouse Brokers, LLC and is, or is in the nature of, a solicitation. This material is not a research report prepared by Powerhouse Brokers, LLC. By accepting this communication, you agree that you are an experienced user of the futures markets, capable of making independent trading decisions, and agree that you are not, and will not, rely solely on this communication in making trading decisions.
DISTRIBUTION IN SOME JURISDICTIONS MAY BE PROHIBITED OR RESTRICTED BY LAW. PERSONS IN POSSESSION OF THIS COMMUNICATION INDIRECTLY SHOULD INFORM THEMSELVES ABOUT AND OBSERVE ANY SUCH PROHIBITION OR RESTRICTIONS. TO THE EXTENT THAT YOU HAVE RECEIVED THIS COMMUNICATION INDIRECTLY AND SOLICITATIONS ARE PROHIBITED IN YOUR JURISDICTION WITHOUT REGISTRATION, THE MARKET COMMENTARY IN THIS COMMUNICATION SHOULD NOT BE CONSIDERED A SOLICITATION.
The risk of loss in trading futures and/or options is substantial and each investor and/or trader must consider whether this is a suitable investment. Past performance, whether actual or indicated by simulated historical tests of strategies, is not indicative of future results. Trading advice is based on information taken from trades and statistical services and other sources that Powerhouse Brokers, LLC believes are reliable. We do not guarantee that such information is accurate or complete and it should not be relied upon as such. Trading advice reflects our good faith judgment at a specific time and is subject to change without notice. There is no guarantee that the advice we give will result in profitable trades.
Copyright © 2024 Powerhouse Brokers, LLC, All rights reserved
POWERHOUSE, 3214 O St NW, Suite #2, Washington, DC 20007, United States, (202) 333-5380