

The LNG Export Wave Begins
- Dramatic changes imminent for U.S. LNG exports
- Latest generation of facilities coming into service
- Export demand growth to double versus recent years
- Gas exports have helped to reduce storage excesses
Sincerely,
David Thompson, CMT
Executive Vice President
Powerhouse
(202) 333-5380
The Matrix
The Weekly Energy Market Situation focuses on larger trends and themes that affect our clients. Chinese and Asian oil demand has justifiably been a frequent subject. But in terms of the global natural gas market, the United States commands center stage when the topic turns to supply.
It is not hyperbolic to say that in the next five years, U.S. LNG exports will undergo a massive sea change. By 2030, U.S. LNG exports are forecast to increase by 85%. LNG carriers are already queuing up at a new export facility in Louisiana and will soon begin doing so at an expanded facility in Corpus Christi. In total, LNG exports are expected to increase by 11 bcf/day.
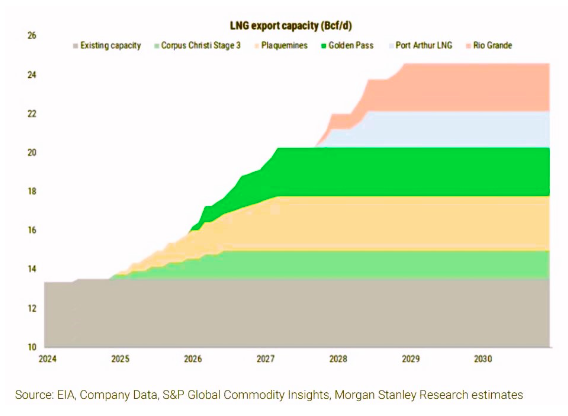
As these five new LNG export facilities come into service, feedgas demand will grow by approximately 2.4 bcf/day. This is more than double the rate of demand growth of the last three years.

To put into perspective where we are in the story, this is the expected ramp-up of the new Louisiana facility.

LNG export demand is a sub-sector of total U.S. natural gas demand. Weather and overall economic conditions remain critical. But the scale of change in U.S. LNG export capacity will draw the eyes of the energy world to the Gulf Coast.
Supply/Demand Balances
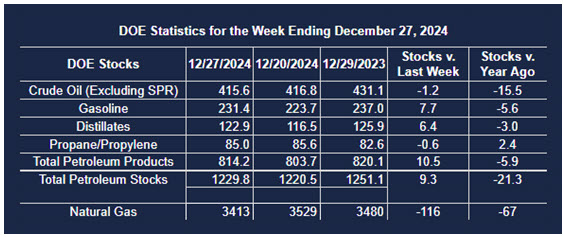
Supply/demand data in the United States for the week ended December 27, 2024, were released by the Energy Information Administration.
Total commercial stocks of petroleum increased (⬆) 9.3 million barrels to 1.2298 billion barrels during the week ended December 27th, 2024.
Commercial crude oil supplies in the United States were lower (⬇) by 1.2 million barrels from the previous report week to 415.6 million barrels.
Crude oil inventory changes by PAD District:
PADD 1: Up (⬆) 0.2 million barrels to 8.3 million barrels
PADD 2: Up (⬆) 1.2 million barrels to 105.1 million barrels
PADD 3: Down (⬇) 4.0 million barrels to 227.5 million barrels
PADD 4: Up (⬆) 0.1 million barrels to 24.4 million barrels
PADD 5: Up (⬆) 1.3 million barrels to 50.3 million barrels
Cushing, Oklahoma, inventories were down (⬇) 0.2 million barrels to 22.5 million barrels.
Domestic crude oil production decreased (⬇) 12,000 barrels per day from the previous report at 13.573 million barrels per day.
Crude oil imports averaged 6.926 million barrels per day, a daily increase (⬆) of 455,000 barrels. Exports increased (⬆) 132,000 barrels daily to 3.854 million barrels per day.
Refineries used 92.7% of capacity; an increase (⬆) of 0.2% from the previous report week.
Crude oil inputs to refineries increased (⬆) 41,000 barrels daily; there were 16.857 million barrels per day of crude oil run to facilities. Gross inputs, which include blending stocks, increased (⬆) 39,000 barrels daily to 16.993 million barrels daily.
Total petroleum product inventories increased (⬆) by 10.5 million barrels from the previous report week, up to 814.2 million barrels.
Total product demand decreased (⬇) 3,286,000 barrels daily to 18.545 million barrels per day.
Gasoline stocks increased (⬆) 7.7 million barrels from the previous report week; total stocks are 231.4 million barrels.
Demand for gasoline decreased (⬇) 840,000 barrels per day to 8.168 million barrels per day.
Distillate fuel oil stocks increased (⬆) 6.4 million barrels from the previous report week; distillate stocks are at 122.9 million barrels. EIA reported national distillate demand at 3.232 million barrels per day during the report week, a decrease (⬇) of 1,022,000 barrels daily.
Propane stocks fell (⬇) 0.6 million barrels from the previous report to 85.0 million barrels. The report estimated current demand at 829,000 barrels per day, a decrease (⬇) of 905,000 barrels daily from the previous report week.
Natural Gas
Increasing flows to U.S. exports facilities along with a colder first half of December pulled natural gas storage levels down to approximately 3.6 Tcf. While this level is about 5% greater than the 5-year average for this time of year, the surplus over last year’s level is now only about 1%.
A base case scenario from one bank projects end-of-March inventories of around 1.84 TcF or 2% below the 5-year average.
Was this helpful? We’d like your feedback.
Please respond to [email protected]
This material has been prepared by a sales or trading employee or agent of Powerhouse Brokers, LLC and is, or is in the nature of, a solicitation. This material is not a research report prepared by Powerhouse Brokers, LLC. By accepting this communication, you agree that you are an experienced user of the futures markets, capable of making independent trading decisions, and agree that you are not, and will not, rely solely on this communication in making trading decisions.
DISTRIBUTION IN SOME JURISDICTIONS MAY BE PROHIBITED OR RESTRICTED BY LAW. PERSONS IN POSSESSION OF THIS COMMUNICATION INDIRECTLY SHOULD INFORM THEMSELVES ABOUT AND OBSERVE ANY SUCH PROHIBITION OR RESTRICTIONS. TO THE EXTENT THAT YOU HAVE RECEIVED THIS COMMUNICATION INDIRECTLY AND SOLICITATIONS ARE PROHIBITED IN YOUR JURISDICTION WITHOUT REGISTRATION, THE MARKET COMMENTARY IN THIS COMMUNICATION SHOULD NOT BE CONSIDERED A SOLICITATION.
The risk of loss in trading futures and/or options is substantial and each investor and/or trader must consider whether this is a suitable investment. Past performance, whether actual or indicated by simulated historical tests of strategies, is not indicative of future results. Trading advice is based on information taken from trades and statistical services and other sources that Powerhouse Brokers, LLC believes are reliable. We do not guarantee that such information is accurate or complete and it should not be relied upon as such. Trading advice reflects our good faith judgment at a specific time and is subject to change without notice. There is no guarantee that the advice we give will result in profitable trades.
Copyright 2025 Powerhouse Brokers, LLC, All rights reserved

