ULSD Prices Retreating; Many Bullish Features Remain in Play
- Historically, seasonally low prices for petroleum prices occur in the first quarter
- DOE projects prices falling in 2023 and 2024
- Uncertainties in China and Russia give an offsetting bullish tone to prices
- Natural gas markets have become international with the U.S. a major player
Sincerely,
Alan Levine, Chairman
Powerhouse
(202) 333-5380
The Matrix
ULSD spot futures are retreating from $3.58, their recent high. Last week, prices settled at $3.2655. Significant support at $2.92 remains intact.
The rally to $3.58 reflected market anxiety that the impact of the February 5 ban on product imports from Russia could add to bullish price pressure. (A ban on Russian crude oil imports to the EU is already in place.)
The loss of Russian fuel into Europe has been significantly blunted for global balances. An independent oil refiner has arranged to sell oil products to Pakistan by land, a first for oil movements. Pakistan has had only limited and expensive access to Gulf States supplies. The EU’s interest in imposing punishment on Russia has fallen victim to the market’s imperative, satisfying demand with supply.
Expectations for price strength are still in play for several reasons. Powerhouse’s Weekly Energy Market Situation has reported on plans for an expanded slate of refinery shutdowns. The market is now at a time of seasonal lows for petroleum prices, especially prices for next winter.
On a larger canvas, the Energy Information Administration forecast that oil prices will fall in 2023 and 2024. Its January 2023 Short Term Energy Outlook bases this on expectations that oil production will exceed consumption internationally. Even EIA concedes that events in China and among non-OPEC oil producers could affect this bearish view.
China’s attempts to reopen its economy post-COVID-19 must overcome negative impacts from mobility restrictions in the country, economic constriction and lower national oil demand. It is not clear how China’s efforts at recovery will affect consumption of oil. If China experiences sustained economic growth through 2024, the impact on global oil balances could support a more bullish price outlook.
Any failure of crude oil production could contribute toward higher prices. OPEC, for example, produced 34% of all petroleum liquids in 2022. But OPEC implemented quota cuts last October, ignoring calls for greater output from the United States to help the global economy. The group has since rescinded the cuts, but the threat of renewed restraint to support prices cannot be ignored. Several members of OPEC+ have struggled to meet their output goals.
Supply/Demand Balances
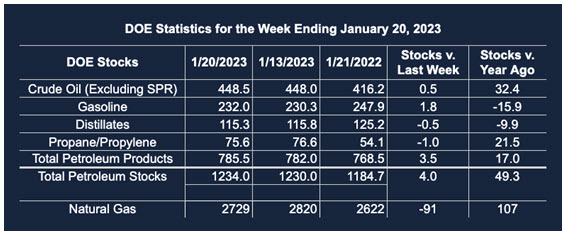
Supply/demand data in the United States for the week ended January 20, 2023, were released by the Energy Information Administration.
Total commercial stocks of petroleum rose (⬆) 4.0 million barrels to 1.234 billion barrels during the week ended January 20, 2023.
Commercial crude oil supplies in the United States increased (⬆) by 0.5 million barrels from the previous report week to 448.5 million barrels.
Crude oil inventory changes by PAD District:
PADD 1: Down (⬇) 0.4 million barrels to 7.3 million barrels
PADD 2: Plus (⬆) 4.9 million barrels to 120.6 million barrels
PADD 3: Down (⬇) 2.0 million barrels to 248.9 million barrels
PADD 4: Plus (⬆) 0.2 million barrels to 25.1 million barrels
PADD 5: Down (⬇) 2.1 million barrels to 46.7 million barrels
Cushing, Oklahoma, inventories were up (⬆) 4.3 million barrels from the previous report week to 35.7 million barrels.
Domestic crude oil production was unchanged from the previous report week at 12.2 million barrels daily.
Crude oil imports averaged 5.905 million barrels per day, a daily decrease (⬇) of 956,000 barrels. Exports increased (⬆) 835,000 barrels daily to 4.707 million barrels per day.
Refineries used 86.1% of capacity; 0.8 percentage points higher (⬆) than the previous report week.
Crude oil inputs to refineries increased (⬆) 127,000 barrels daily; there were 14.981 million barrels per day of crude oil run to facilities. Gross inputs, which include blending stocks, rose (⬆) 143,000 barrels daily to 15.517 million barrels daily.
Total petroleum product inventories rose (⬆) by 3.5 million barrels from the previous report week, rising to 785.5 million barrels.
Total product demand decreased (⬇) 866,000 barrels daily to 19.447 million barrels per day.
Gasoline stocks increased (⬆) 1.8 million barrels from the previous report week; total stocks are 232.0 million barrels.
Demand for gasoline increased (⬆) 88,000 barrels per day to 8.142 million barrels per day.
Distillate fuel oil stocks decreased (⬇) 0.5 million barrels from the previous report week; distillate stocks are at 115.3 million barrels. EIA reported national distillate demand at 3.878 million barrels per day during the report week, a decrease (⬇) of 146,000 barrels daily.
Propane stocks decreased (⬇) by 1.0 million barrels from the previous report week to 75.6 million barrels. The report estimated current demand at 1.052 million barrels per day, a decrease (⬇) of 466,000 barrels daily from the previous report week.
Natural Gas
Natural gas has become an international commodity, following years of predominantly domestic use. The response to Russian aggression in Ukraine has included limits imposed on allowable exports of Russian energy supplies. LNG exports from the United States to Europe have been part of the reaction.
The move overseas will be supported by the construction of new export facilities and the expected return to service of the Freeport plant. The Department of Energy estimates that “Europe increased its LNG imports by 66% (5.9 Bcf/d) in 2022 compared with 2021.” The Department expects expanding import capability to result in 34% more LNG in 2024 compared with 2021.
According to the EIA:
Net withdrawals from storage totaled 91 Bcf for the week ended January 20, compared with the five-year (2018–2022) average net withdrawals of 185 Bcf and last year’s net withdrawals of 217 Bcf during the same week. Working natural gas stocks totaled 2,729 Bcf, which is 128 Bcf (5%) more than the five-year average and 107 Bcf (4%) more than last year at this time.
Was this helpful? We’d like your feedback.
Please respond to [email protected]
Powerhouse Futures & Trading Disclaimer
Copyright 2023 Powerhouse Brokerage, LLC, All rights reserved