

This Year’s Outlook for Oil and Gas Generally Supportive
- Oil prices ended last year on a rally
- The U.S. likely to be a net crude oil exporter in 2023
- Exploration and production of crude oil seen recovering
- LNG outlook strengthening despite renewables challenge.
Sincerely,
Alan Levine, Chairman
Powerhouse
(202) 333-5380
The Matrix
Diesel fuel futures gained 40% in 2022. A strong close on Friday, December 30 capped ULSD’s rally, settling at $3.2950 for the February contract. Failures of supply, chronicled by Powerhouse’s Weekly Energy Market Situation throughout the year, were the principal cause, including refinery shutdowns, outage on domestic pipelines, and volatile weather patterns.
Crude oil futures ended the year on an up note. WTI crude oil topped $80 per barrel, finishing the year at $80.26 for spot February.
The United States could also be a net exporter of crude oil in 2023. This would be a position not seen since the Second World War. Failure of supply from Russia has increased demand for U.S. crudes. Exports are now at 3.4 million barrels daily. And with demand in the United States pushing 20 million barrels per day, U.S. production will have to rise to provide crude oil for the export markets.

The opportunity for shale oil drillers is undeniable. Now-aging fields and perhaps the re-direction of funds to exploration and production could lead to a renewal among drillers.
International events were at play too. Covid policies in China, the invasion of Ukraine by Russia and the retaliatory policies that followed including embargos and price caps added to chaotic economic conditions.
2022 is in the rear window now. Inflation may have peaked – although it is still a national concern. The Federal Reserve slowed the rate at which has been raising rates in its efforts to control prices.
Without a recession, the price outlook for 2023 should be strong. One investment bank expects an uneven first quarter, reflecting further dollar weakening and Chinese economic challenges stemming from its Covid policies. The bank then expects higher prices to sustain, reflecting the current upstream underinvestment.
Supply/Demand Balances
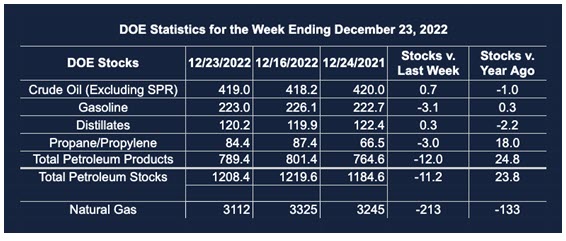
Supply/demand data in the United States for the week ended December 23, 2022, were released by the Energy Information Administration.
Total commercial stocks of petroleum fell (⬇) 11.2 million barrels to 1.208 billion barrels during the week ended December 23, 2022.
Commercial crude oil supplies in the United States increased (⬆) by 0.7 million barrels from the previous report week to 419.0 million barrels.
Crude oil inventory changes by PAD District:
PADD 1: Plus (⬆) 0.7 million barrels to 8.2 million barrels
PADD 2: Down (⬇) 0.1 million barrels to 105.9 million barrels
PADD 3: Plus (⬆) 1.0 million barrels to 231.7 million barrels
PADD 4: Down (⬇) 0.6 million barrels to 24.4 million barrels
PADD 5: Down (⬇) 0.1 million barrels to 48.8 million barrels
Cushing, Oklahoma, inventories were down (⬇) 0.2 million barrels from the previous report week to 25.0 million barrels.
Domestic crude oil production was down (⬇) 100,000 barrels daily from the previous report week at 12.0 million barrels daily.
Crude oil imports averaged 6.252 million barrels per day, a daily increase (⬆) of 433,000 barrels. Exports decreased (⬇) 895,000 barrels daily to 3.465 million barrels per day.
Refineries used 92.0% of capacity; 1.1 percentage points higher (⬆) than the previous report week.
Crude oil inputs to refineries increased (⬆) 173,000 barrels daily; there were 16.149 million barrels per day of crude oil run to facilities. Gross inputs, which include blending stocks, rose (⬆) 203,000 barrels daily to 16.586 million barrels daily.
Total petroleum product inventories fell (⬇) by 12.0 million barrels from the previous report week, falling to 789.4 million barrels.
Total product demand increased (⬆) 1.898 million barrels daily to 22.822 million barrels per day.
Gasoline stocks decreased (⬇) 3.1 million barrels from the previous report week; total stocks are 223.0 million barrels.
Demand for gasoline increased (⬆) 613,000 barrels per day to 9.327 million barrels per day.
Distillate fuel oil stocks increased (⬆) 0.3 million barrels from the previous report week; distillate stocks are at 120.2 million barrels. EIA reported national distillate demand at 3.880 million barrels per day during the report week, a decrease (⬇) of 134,000 barrels daily.
Propane stocks decreased (⬇) by 3.0 million barrels from the previous report week to 84.4 million barrels. The report estimated current demand at 1.692 million barrels per day, a decrease (⬇) of 35,000 barrels daily from the previous report week.
Natural Gas
Henry Hub spot futures were under pressure as 2022 ended, despite a withdrawal from storage well in excess of market expectations. Near-term weather forecasts are “much warmer than normal.” Moreover, what cold may appear is not connected to a larger body of cold. Bulls are not getting help from the weather.
But LNG developments continue apace. Japanese companies will be buying more liquifies natural gas (LNG) from the U.S. and from Oman. The country is seeking access to new LNG supplies as a matter of national security.
These arrangements should supplement deals in the short-term spot market that were providing natural gas supply. They are a change from expectations that cleaner energy supplies could supplant natural gas in the Japanese energy mix within the next decade.
Anticipated moves away from fossil fuel toward cleaner energy sources have become the accepted truth by energy interests. The reality appears to running into resistance.
The renewable movement faces challenges from cost competition, legal requirements and administrative policies lagging and beholden to established fossil fuel practices, social acceptance of some new renewable sources, and unanticipated impacts of some renewable initiatives on the environment. Renewables may be the future; their present is more tenuous.
According to the EIA:
Working gas in storage was 3,112 Bcf as of Friday, December 23, 2022, according to EIA estimates. This represents a net decrease of 213 Bcf from the previous week. Stocks were 133 Bcf less than last year at this time and 85 Bcf below the five-year average of 3,197 Bcf. At 3,112 Bcf, total working gas is within the five-year historical range.

Was this helpful? We’d like your feedback.
Please respond to [email protected]
Powerhouse Futures & Trading Disclaimer
Copyright 2022 Powerhouse Brokerage, LLC, All rights reserved


