Petroleum Product Prices Power Higher
- ULSD spot futures gained 22% in 2023’s first three weeks
- Planned refinery maintenance could shelve 1.4 million barrels of capacity this spring
- EU sanctions on Russian refined products to start February 5
- Natural gas consumption in the lower 48 states hit record highs as 2022 ended
Sincerely,
Alan Levine, Chairman
Powerhouse
(202) 333-5380
The Matrix
The year has opened with extremely strong price performances by petroleum products, and only modestly less so by WTI spot crude oil futures. Early in the year ULSD futures reached a low of $2.92 and then rallied to $3.57 on January 23, 2023. The $0.65 gallon rally was an increase of value in middle distillates of more than 22% over three weeks.
There have been few price set-backs, and the pattern might continue. Operational problems as well as planned shutdowns signal product supply concerns going forward. West Coast refinery output has been impacted by an outage at the Phillips 66 Rodeo, CA plant. This follows the decommissioning of another Phillips facility at Santa Maria, CA a few weeks ago. East Coast markets will pay the price of Bayway’s 60-day maintenance. This will limit the availability of local gasoline blend stock in New York Harbor.
Planned refinery shutdowns are expected at an accelerated pace this spring reflecting resumption of pandemic-delayed maintenance. At least 15 refineries will undertake maintenance through May. By mid-February, 1.4 million barrels of capacity could be off-line, reportedly twice the average of the past five years.
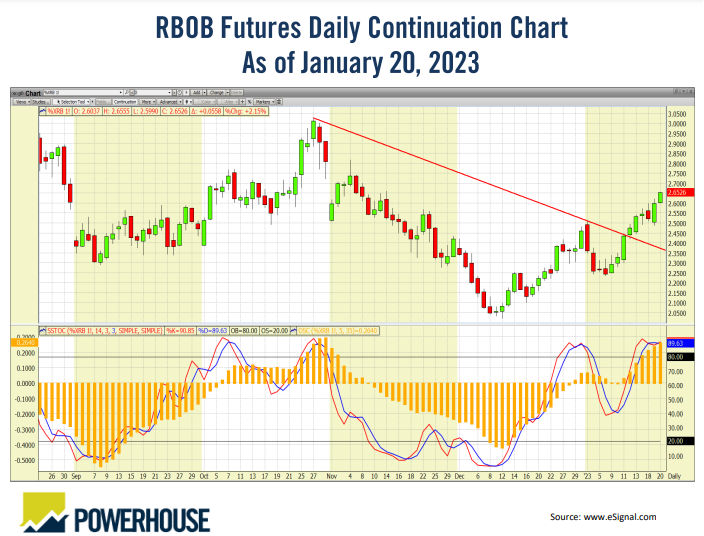
RBOB spot futures have seen substantial price increases too. Their rate has slowed in recent days, but the same issues of refinery constraints should keep the rally in place.
Supply/Demand Balances
Supply/demand data in the United States for the week ended January 13, 2023, were released by the Energy Information Administration.
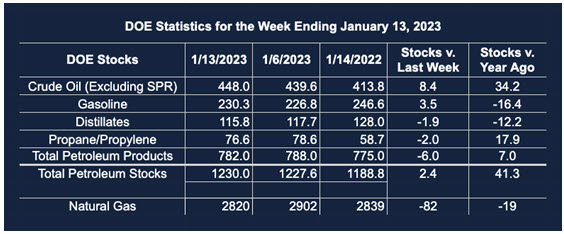
Total commercial stocks of petroleum rose (⬆) 2.4 million barrels to 1.230 billion barrels during the week ended January 13, 2023.
Commercial crude oil supplies in the United States increased (⬆) by 8.4 million barrels from the previous report week to 448.0 million barrels.
Crude oil inventory changes by PAD District:
PADD 1: Down (⬇) 0.3 million barrels to 7.7 million barrels
PADD 2: Plus (⬆) 5.7 million barrels to 115.7 million barrels
PADD 3: Plus (⬆) 1.4 million barrels to 250.9 million barrels
PADD 4: Plus (⬆) 0.1 million barrels to 24.9 million barrels
PADD 5: Down (⬇) 1.5 million barrels to 48.8 million barrels
Cushing, Oklahoma, inventories were up (⬆) 3.6 million barrels from the previous report week to 31.4 million barrels.
Domestic crude oil production was unchanged from the previous report week at 12.2 million barrels daily.
Crude oil imports averaged 6.861 million barrels per day, a daily increase (⬆) of 511,000 barrels. Exports increased (⬆) 1.735 million barrels daily to 3.872 million barrels per day.
Refineries used 85.3% of capacity; 1.2 percentage points higher (⬆) than the previous report week.
Crude oil inputs to refineries increased (⬆) 203,000 barrels daily; there were 14.853 million barrels per day of crude oil run to facilities. Gross inputs, which include blending stocks, rose (⬆) 214,000 barrels daily to 15.374 million barrels daily.
Total petroleum product inventories fell (⬇) by 6.0 million barrels from the previous report week, falling to 782.0 million barrels.
Total product demand increased (⬆) 2.686 million barrels daily to 20.314 million barrels per day.
Gasoline stocks increased (⬆) 3.5 million barrels from the previous report week; total stocks are 230.3 million barrels.
Demand for gasoline increased (⬆) 496,000 barrels per day to 8.054 million barrels per day.
Distillate fuel oil stocks decreased (⬇) 1.9 million barrels from the previous report week; distillate stocks are at 115.8 million barrels. EIA reported national distillate demand at 4.024 million barrels per day during the report week, an increase (⬆) of 204,000 barrels daily.
Propane stocks decreased (⬇) by 2.0 million barrels from the previous report week to 76.6 million barrels. The report estimated current demand at 1.518 million barrels per day, an increase (⬆) of 297,000 barrels daily from the previous report week.
Natural Gas
The impact of extreme weather as 2022 ended appeared in data from the Department of Energy’s Natural Gas Weekly Update for the week ended January 18, 2023. Unusual data were reported for both supply and demand, but natural gas consumption in the lower 48 states hit record highs of 141.0 Bcf. The previous record of 137.4 Bcf was recorded January 1, 2018. Higher Heating Degree Days were felt in the second half of December while production weathered weather-related declines.

Powerhouse has documented powerful — even historic – winter storms across the nation at that time. They brought blizzards, strong winds, and very low temperatures. This interfered with many natural gas activities heightening demand and suppressing supply.
EIA documented falling dominoes in response to spike in HDD’s:
- Electric loads strained grids
- Freeze caused outages cut operational capacity in some markets
- The TVA boosted generation to record highs for the system
- Rolling outages were used to protect the electric grid
- Texas and the Southwest set winter record high power generation.
Limited pipeline capacity constrained delivery to New England power plants. Natural gas’s share of regional power generation fell from 57% for December 22, and 23 to 24% for next three days Supply was provided from oil powering generation facilities. The four days before December 21 saw virtually no oil used for generation.
Natural gas production slumped during this period creating a supply shortfall met only by higher imports from Canada, and withdrawals from underground storage. EIA notes that “Withdrawals from working underground storage of natural gas across the Lower 48 states were 213.0 Bcf for the week ended December 23 and 221.0 Bcf for the week ended December 30, compared with last year’s withdrawals of 136.0 Bcf for the week ended December 24, 2022 and 31.0 Bcf for the week ended December 31, 2022.”
According to the EIA:
Net {natural gas} withdrawals from storage totaled 82 Bcf for the week ended January 13, compared with the five-year (2018–2022) average net withdrawals of 156 Bcf and last year’s net withdrawals of 203 Bcf during the same week. Working natural gas stocks totaled 2,820 Bcf, which is 34 Bcf (1%) more than the five-year average and 19 Bcf (1%) lower than last year at this time.
The average rate of withdrawals from storage is 17% lower than the five-year average so far in the withdrawal season (November through March). If the rate of withdrawals from storage matched the five-year average of 16.3 Bcf/d for the remainder of the withdrawal season, the total inventory would be 1,566 Bcf on March 31, which is 34 Bcf higher than the five-year average of 1,532 Bcf for that time of year.
Was this helpful? We’d like your feedback.
Please respond to [email protected]
Powerhouse Futures & Trading Disclaimer
Copyright 2023 Powerhouse Brokerage, LLC, All rights reserved