Crude Oil Resists the Downside
- U.S. production to exceed Saudi Arabia’s in 2018
- American crude output offsets 60% of OPEC cuts
- Concerns overseas also support price
- Natural gas production boosted by exports

The Matrix
The continuing success of U.S. shale production should be pressing crude oil prices lower but markets have not cooperated; prices have not broken support in any significant way.
The volume of domestic shale oil production in 2018 is expected to pass Saudi Arabian output and challenge Russian supply according to the International Energy Agency. U.S. output in excess of 10 million barrels daily seems assured, helped by higher crude prices. IEA has estimated that U.S. production will reach 10.4 million barrels per day this year.
Efforts to counter American production growth have engaged the OPEC group and Russia in cutting output. OPEC estimates that its efforts have reduced global oil supply by about two per cent.
The power of the United States’ production to influence global supply and price has been immense. IEA estimates that domestic output has offset 60% of OPEC/Russian output cuts.
Prices have moved higher despite the availability of American crude oil. Constraints on supply are particularly important in Venezuela. The national economy has effectively collapsed and the oil industry is reaping the effect of long-term mismanagement.
Other foreign concerns include the possibility that Turkey could interfere with oil flows from Kurdish Iraq. Uncertainty over the United States’ position on the Iranian nuclear agreement supports prices as well. Analysts also believe that Saudi Arabia’s production cuts are intended to support prices in front of the ARAMCO Initial Public Offering.
Against these bullish concerns, traders face several bearish considerations. It is at least possible that tensions ease as the Saudi royal family works through significant change. Moreover, too great a cutback could threaten Saudi market share. Higher global demand has added to price pressures that could ease should demand fall back.
Some analysts are projecting $60 WTI for 2018. Others think the $70-$80 range cannot be dismissed. But as always, the best cure for high prices is high prices. Current activity has attracted many speculative longs. Any change in sentiment could easily turn into a rout with WTI prices correcting to somewhere in the low $50 range.
Supply/Demand Balances
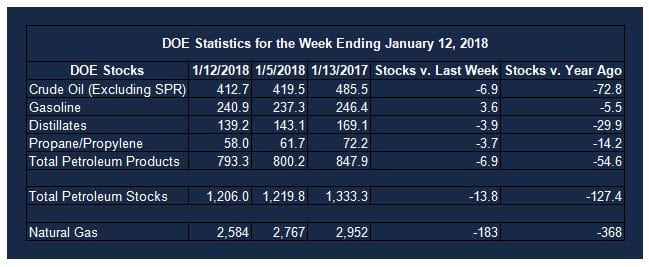
Supply/demand data in the United States for the week ending January 12, 2018 were released by the Energy Information Administration.
Total commercial stocks of petroleum fell 13.8 million barrels during the week ending January 12, 2017.
Builds were reported in stocks of gasoline and residual fuel oil. Draws were reported in stocks of K-jet fuel, distillates, propane and other oils. Stocks of fuel ethanol were unchanged from the previous report week.
Commercial crude oil supplies in the United States decreased to 412.7 million barrels, a draw of 6.9 million barrels.
Crude oil supplies decreased in three of the five PAD Districts. PAD District 2 (Midwest) crude oil stocks declined 4.0 million barrels, PADD 3 (Gulf Coast) stocks fell 1.0 million barrels, and PADD 5 (West Coast) stocks retreated 2.3 million barrels. PAD District 1 (East Coast) stocks increased 0.2 million barrels and PADD 4 (Rockies) stocks rose 0.2 million barrels.
Cushing, Oklahoma inventories decreased 4.2 million barrels from the previous report week to 42.4 million barrels.
Domestic crude oil production increased 258,000 barrels daily to 9.750 million barrels per day from the previous report week.
Crude oil imports averaged 7.950 million barrels per day, a daily increase of 292,000 barrels. Exports rose 234,000 barrels daily to 1.249 million barrels per day.
Refineries used 93.0 per cent of capacity, a decrease of 2.3 percentage points from the previous report week.
Crude oil inputs to refineries decreased 448,000 barrels daily; there were 16.875 million barrels per day of crude oil run to facilities. Gross inputs, which include blending stocks, fell 420,000 barrels daily to 17.209 million barrels daily.
Total petroleum product inventories saw a decrease of 6.9 million barrels from the previous report week.
Gasoline stocks rose 3.6 million barrels from the previous report week; total stocks are 240.9 million barrels.
Demand for gasoline decreased 146,000 barrels per day to 8.668 million barrels daily.
Total product demand increased 170,000 barrels daily to 20.809 million barrels per day.
Distillate fuel oil supply fell 3.9 million barrels from the previous report week to 139.2 million barrels. National distillate demand was reported at 4.738 million barrels per day during the report week. This was a weekly increase of 1.083 million barrels daily.
Propane stocks decreased 3.7 million barrels from the previous report week to 58.0 million barrels. Current demand is estimated at 1.543 million barrels per day, a decrease of 349,000 barrels daily from the previous report week.
Natural Gas
According to the Energy Information Administration:
Weekly withdrawal levels are lower than the five-year average for the first time in three weeks. Net withdrawals from storage totaled 183 Bcf for the week ending January 12, compared with the five-year (2013–17) average net withdrawal of 203 Bcf and last year’s net withdrawals of 230 Bcf during the same week. Working gas stocks totaled 2,584 Bcf, which is 362 Bcf less than the five-year average and 368 Bcf less than last year at this time.
EIA’s Short-Term Energy Outlook (STEO), released January 9, 2018, estimates that U.S. dry natural gas production averaged a record-high 78.1 billion cubic feet per day (Bcf/d) during December 2017, topping the previous estimated record set the month before when dry U.S. production averaged 77.3 Bcf/d. STEO forecasts that dry U.S. natural gas production will average 73.6 Bcf/d in 2017, or 0.7 Bcf/d (1%) higher than 2016 average production of 72.9 Bcf/d. STEO’s forecast 2017 production is still lower than the record annual average U.S. natural gas production of 74.2 Bcf/d in 2015.
Several factors supported higher levels of dry natural gas production in 2017. Total natural gas demand was higher in the last three months of 2017 than during the same period in 2016, in part because of higher levels of pipeline and liquefied natural gas (LNG) exports. Pipeline exports to Mexico increased by 0.4 Bcf/d (9%) in the last three months of 2017 compared to the same period in 2016, while LNG exports increased by 1.9 Bcf/d (176%).
Futures trading involves significant risk and is not suitable for everyone. Transactions in securities futures, commodity and index futures and options on future markets carry a high degree of risk. The amount of initial margin is small relative to the value of the futures contract, meaning that transactions are heavily “leveraged”. A relatively small market movement will have a proportionately larger impact on the funds you have deposited or will have to deposit: this may work against you as well as for you. You may sustain a total loss of initial margin funds and any additional funds deposited with the clearing firm to maintain your position. If the market moves against your position or margin levels are increased, you may be called upon to pay substantial additional funds on short notice to maintain your position. If you fail to comply with a request for additional funds within the time prescribed, your position may be liquidated at a loss and you will be liable for any resulting deficit. Past performance may not be indicative of future results. This is not an offer to invest in any investment program.
Powerhouse is a registered affiliate of Coquest, Inc.
Was this helpful? We’d like your feedback.
Please respond to [email protected]
Copyright © 2018 Powerhouse, All rights reserved.
You are receiving this e-mail as a friend of Powerhouse