Winter Is at a Trough; Price Direction at Critical Point
- NOAA produces a list of coldest cities
- U.S. snow cover at 41%
- EIA projects lower crude oil prices
- EIA projects lower natural gas prices

Alan Levine—Chairman, Powerhouse
(202) 333-5380
The Matrix
We are at the trough of winter. Around this time, the coldest weather occurs in most of the country. Temperatures should warm going forward as the sun rises higher each day, depending of course, on local conditions such as snow cover.
The National Climatic Data Center, a division of the National Oceanic and Atmospheric Administration (NOAA) has produced data on U.S. cities with the lowest average daily temperatures in meteorological winter (December, January, and February.) The coldest, by far, is Minneapolis, Minnesota, with a daily winter mean of 19° F. Chicago clocks in at 26° F and Buffalo at 27° F. Other locations important in the heating oil industry include Hartford, CT at 29°F, Indianapolis, IN (31°F) and Providence, RI and Boston, MA each at 32°F. (Call me for other places.)
The National Weather Service provides data on snowfall and snow coverage. Nationally, 41% of the United States was covered by an average of 4.1 inches of snow on Jan. 18, 2022. Last month, the Service estimated that 28.7% of the country was snow-covered. So much snow cover could retard warming as sunlight is reflected and less absorbed as winter advances. NOAA says that “Snow cover reflects about 80 to 90 percent of the sun’s energy back into the atmosphere…. In addition to helping keep the atmosphere cool, snow cover also helps keep the ground warm.”
Weather considerations aside, the EIA forecasts lower crude oil prices through 2023. Crude oil consumption has risen faster than production in the past year-and-one-half, according to EIA. This has spurred inventory loss and higher prices.
POWERHOUSE has documented loss of output from the OPEC+ group, restraint among U.S. oil producers, and other supply curtailments. Supplies now appear to be coming into better alignment with demand. EIA believes global markets will be better aligned in the first quarter of 2022. Rising production will lead to fatter inventories this year into 2023. Domestic production this year is running 11.7 million barrels daily this year. Last year at this time, output was at eleven million barrels.
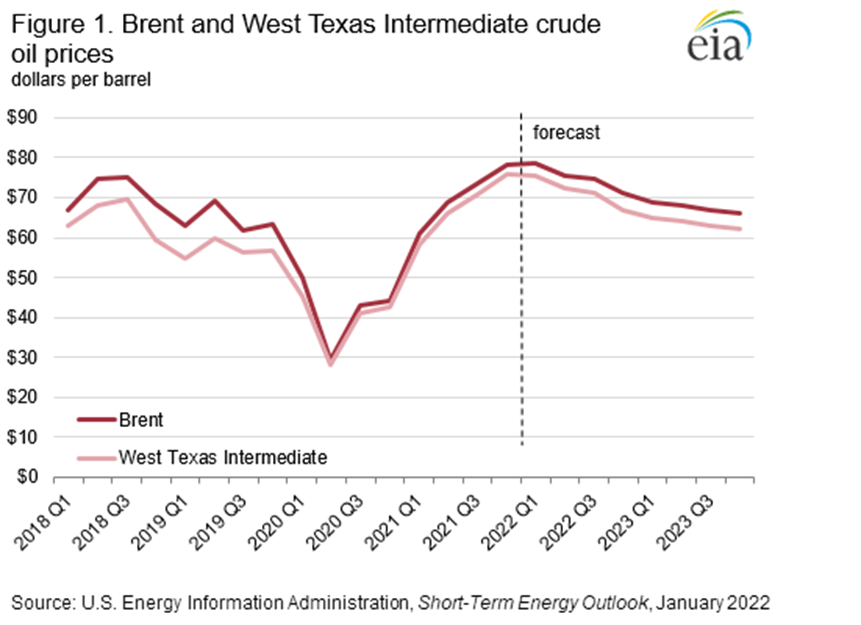
Brent & WTI Price Chart Q1 2018 – Q3 2023 Source: EIA
This is at odds with other projections examined by POWERHOUSE. These differences will be the subject of further review as the year advances.
Supply/Demand Balances
Supply/demand data in the United States for the week ended Jan. 7, 2022, were released by the Energy Information Administration.
Total commercial stocks of petroleum rose 4.2 million barrels during the week ended Jan. 7, 2022.
Commercial crude oil supplies in the United States decreased by 4.6 million barrels from the previous report week to 413.3 million barrels.
Crude oil inventory changes by PAD District:
PADD 1: Down 1 million barrels to 7.2 million barrels
PADD 2: Down 2.9 million barrels to 114.3 million barrels
PADD 3: Down 2.8 million barrels to 220.3 million barrels
PADD 4: Down 0.6 million barrels to 23.2 million barrels
PADD 5: Plus 2.8 million barrels to 48.1 million barrels
Cushing, Oklahoma, inventories were down 2.5 million barrels from the previous report week to 34.8 million barrels.
Domestic crude oil production was down 100,000 barrels per day from the previous report week to 11.7 million barrels daily.
Crude oil imports averaged 6.069 million barrels per day, a daily increase of 185,000 barrels. Exports decreased 599,000 barrels daily to 1.955 million barrels per day.
Refineries used 88.4% of capacity; 0.4 percentage points lower from the previous report week.
Crude oil inputs to refineries decreased 294,000 barrels daily; there were 15.703 million barrels per day of crude oil run to facilities. Gross inputs, which include blending stocks, fell 252,000 barrels daily to 16.029 million barrels daily.
Total petroleum product inventories rose 0.1 million barrels from the previous report week.
Gasoline stocks increased 8 million barrels from the previous report week; total stocks are 240.7 million barrels.
Demand for gasoline fell by 265,000 barrels per day to 7.906 million barrels per day.
Total product demand increased 1,164,000 barrels daily to 20.829 million barrels per day.
Distillate fuel oil stocks increased 2.5 million barrels from the previous report week; distillate stocks are at 129.4 million barrels. EIA reported national distillate demand at 3.749 million barrels per day during the report week, an increase of 10,000 barrels daily.
Propane stocks decreased 3.4 million barrels from the previous report week; propane stocks are at 62.4 million barrels. The report estimated current demand at 1.564 million barrels per day, a decrease of 181,000 barrels daily from the previous report week.
Natural Gas
The year 2022 began with a rally in natural gas that brought Henry Hub spot futures prices from $2.6 at the start of January to $4.88 last week. Post-MLK Day, values have moved to $4.33. This is more in line with the long-run expectations of EIA which expects prices to average $3.79 this year. The government projects 2023 prices to fall to $3.63. The Agency expects domestic production of dry natural gas to exceed gains in domestic demand and exports.
According to the EIA:
Net withdrawals from storage totaled 179 Bcf for the week ended January 7, compared with the five-year (2017–2021) average net withdrawals of 155 Bcf and last year’s net withdrawals of 134 Bcf during the same week. Working natural gas stocks totaled 3,016 Bcf, which is 72 Bcf more than the five-year average and 199 Bcf lower than last year at this time.
The average rate of withdrawals from storage is 23% lower than the five-year average so far in the withdrawal season (November through March). If the rate of withdrawals from storage matched the five-year average of 15.4 Bcf/d for the remainder of the withdrawal season, the total inventory would be 1,738 Bcf on March 31, which is 72 Bcf higher than the five-year average of 1,666 Bcf for that time of year.
Was this helpful? We’d like your feedback.
Please respond to [email protected]
Powerhouse Futures & Trading Disclaimer
Copyright 2021 Powerhouse Brokerage, LLC, All rights reserved