Crude oil breaks $52
- WTI heading towards $54.50
- Democratic control of government bullish for oil price
- Short-term economic boost from Covid recovery may fade in longer-term
- Natural gas prices struggle to reach higher

Alan Levine—Chairman, Powerhouse
(202) 333-5380
The Matrix
Oil prices have moved steadily higher since November 2 when WTI spot futures bottomed at $33.64. Since then, a steady advance has seen WTI prices break $50 and set new resistance at $54.50.
The economic/political environment has changed as well. Expectations for the economy are more optimistic. Development of a successful Covid-19 vaccine opens the prospect of a return to a more normal social situation sooner than later. It would appear too that the political situation, unsure since the November presidential election is at last clarifying.
A Congress and Presidency in the hands of Democrats should make it easier to achieve their priorities. Stimulus programs should increase demand and lead to higher fuel prices.
Nuclear negotiations with Iran by contrast could add as much as two million barrels daily to supply. At the same time, Saudi Arabia has said it would cut up to an added one million barrels daily to support prices if needed.
A Longer-Termed Price View
Short term recovery in the global economy could produce a 2021 GDP gain of 5.2% according to the International Monetary Fund. This would be an increase over a Covid-19-depressed minus 4.4 percent 2020 GDP.
Solid growth in 2021 GDP should bring the economy to about where it was before the pandemic. Further gains could be inhibited, reflecting a global economy already under stress before the pandemic. The World Bank reminds us that economic growth faced the challenges of an aging population and lower growth in productivity.
The Bank, in a new analysis, expects economic growth to slow to 1.9% annually until 2029. This assumes full employment and capacity through the period. Earlier, the Bank had estimated growth to be 2.1 percent on average. Reluctance to make new investments under uncertainty would contribute to slower growth. Moreover, unemployment and loss of educational facilities could lead to loss of knowledge and labor market skills.
Supply/Demand Balances
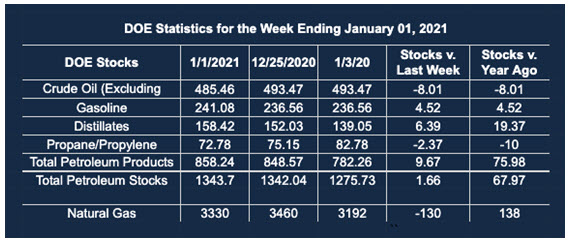
Supply/demand data in the United States for the week ended January 1, 2021 were released by the Energy Information Administration.
Total commercial stocks of petroleum rose by 1.7 million barrels during the week ended January 1, 2021.
Commercial crude oil supplies in the United States decreased by 8.0 million barrels from the previous report week to 485.5 million barrels.
Crude oil inventory changes by PAD District:
PADD 1: Down 0.3 million barrels to 10.3. million barrels
PADD 2: Down 0.4 million barrels to 146.5 million barrels
PADD 3: Down 6.3 million barrels to 258.6 million barrels
PADD 4: Down 0.8 million barrels to 23.7 million barrels
PADD 5: Down 0.3 million barrels to 46.3 million barrels
Cushing, Oklahoma inventories were plus 0.8 million barrels from the previous report week to 59.2 million barrels.
Domestic crude oil production was unchanged from the previous report week at 11.0 million barrels daily.
Crude oil imports averaged 5.369 million barrels per day, a daily increase of 43,000 barrels. Exports increased 7,000 barrels daily to 3.632 million barrels per day.
Refineries used 80.7% of capacity, up 1.3% from the previous report week.
Crude oil inputs to refineries increased 89,000 barrels daily; there were 14.376 million barrels per day of crude oil run to facilities. Gross inputs, which include blending stocks, rose 243,000 barrels daily to 14.834 million barrels daily.
Total petroleum product inventories rose 9.7 million barrels from the previous report week.
Gasoline stocks increased 4.5 million barrels daily from the previous report week; total stocks are 241.1 million barrels.
Demand for gasoline fell 687,000 barrels per day to 7.441 million barrels per day.
Total product demand decreased 2.263 million barrels daily to 17.054 million barrels per day.
Distillate fuel oil stocks increased 6.4 barrels from the previous report week; distillate stocks are at 158.4 million barrels. EIA reported national distillate demand at 2.941 million barrels per day during the report week, a decrease of 653,000 barrels daily.
Propane stocks decreased 2.4 million barrels from the previous report week; propane stocks are 72.8 million barrels. The report estimated current demand at 1.702 million barrels per day, a decrease of 53,000 barrels daily from the previous report week.
Natural Gas
Natural gas spot futures struggle to reach higher. Futures prices topped on November 2, 2020 at $3.393. Since then, each attempt to rally has failed. Prices reached $3.087 on November 13. A series of lower highs introduced new levels of resistance. The most recent failed high came on January 6, 2021 at $2.77.
Lower highs have developed despite growing export demand for LNG. December exports set a new record of 9.8 billion cubic feet per day, following a new-record November. New high exports of LNG came about because of below-normal Asian temperatures. Unplanned outages at export facilities in Australia, Malaysia, and several other nations added to higher overseas prices, attracting more geographically-flexible U.S. LNG.
According to the EIA:
Working [natural] gas in storage was 3,330 Bcf as of Friday, January 1, 2021, according to EIA estimates. This represents a net decrease of 130 Bcf from the previous week. Stocks were 138 Bcf higher than last year at this time and 201 Bcf above the five-year average of 3,129 Bcf. At 3,330 Bcf, total working gas is within the five-year historical range.
Was this helpful? We’d like your feedback.
Please respond to [email protected]
Powerhouse Futures & Trading Disclaimer
Copyright 2020 Powerhouse Brokerage, LLC, All rights reserved