Tariff Uncertainty Grips Markets
- Trump Administration follows through on tariff promise with conditions
- Energy imports from Canada and Mexico initially tariffed at 10% not 25%
- Mexican tariffs paused for one month after political negotiations, no word yet on Canada
- Natural gas futures volatility pulse may be ended
Sincerely,
David Thompson, CMT
Executive Vice President
Powerhouse
(202) 333-5380
The Matrix
Over the weekend the Trump Administration announced 25% tariffs on Canadian and Mexican imports (10% on energy commodities) and 10% on China. By mid-morning on Monday, Trump announced that after negotiations with the Mexican president, the tariffs had been paused for one month. Conversations are ongoing with Canada’s leadership. No retaliatory measures have yet been announced by China.
ULSD and RBOB futures contracts have already established daily trading ranges (intraday high to low) of nearly 10 cents per gallon. The prospect of disruptions to three of the United States’ biggest trading relationships has rippled through asset classes around the world.
Some bank analysts assess that the impact of the 10% tariff of Canadian crude oil imports will have a muted impact. Some Canadian producers may opt to absorb some of the cost because they have limited options to move their product to other buyers.
While the discussion of tariffs on the 3.8 million barrels/day of Canadian oil imports to the U.S. is headline-grabbing, the developments with China may have longer-term impact on energy prices. As Powerhouse has discussed previously, the Chinese economy has been struggling to re-ignite, post-Covid. Any downgrades to Chinese GDP because of trade restrictions would only add an additional headwind to the struggling Chinese economy and its energy demand.
Political decisions can generate substantial moves because entire foundations for price structure can be changed with a tweet. Customers can become paralyzed by FOMO. They fear locking in a price now and missing out on a big drop in price later. Trading environments like this are where options strategies can be very effective for marketers and their customers. Please reach out to Powerhouse if you’d like to discuss how you can reposition yourself with your customers and drive more business.
Supply/Demand Balances
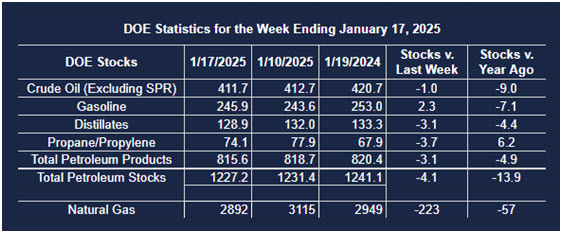
Supply/demand data in the United States for the week ended January 24, 2025, were released by the Energy Information Administration.
Total commercial stocks of petroleum decreased (⬇) 13.9 million barrels to 1.2133 billion barrels during the week ended January 24th, 2025.
Commercial crude oil supplies in the United States were higher (⬆) by 3.5 million barrels from the previous report week to 415.1 million barrels.
Crude oil inventory changes by PAD District:
PADD 1: Down (⬇) 0.7 million barrels to 7.1 million barrels
PADD 2: Up (⬆) 0.2 million barrels to 102.8 million barrels
PADD 3: Up (⬆) 4.2 million barrels to 232.4 million barrels
PADD 4: Down (⬇) 0.7 million barrels to 23.9 million barrels
PADD 5: Up (⬆) 0.3 million barrels to 48.9 million barrels
Cushing, Oklahoma, inventories were up (⬆) 0.3 million barrels to 21.0 million barrels.
Domestic crude oil production decreased (⬇) 237,000 barrels per day from the previous report at 13.240 million barrels per day.
Crude oil imports averaged 6.448 million barrels per day, a daily decrease (⬇) of 297,000 barrels. Exports decreased (⬇) 829,000 barrels daily to 3.686 million barrels per day.
Refineries used 83.5% of capacity; a decrease (⬇) of 2.4% from the previous report week.
Crude oil inputs to refineries decreased (⬇) 333,000 barrels daily; there were 15.189 million barrels per day of crude oil run to facilities. Gross inputs, which include blending stocks, decreased (⬇) 444,000 barrels daily to 15.318 million barrels daily.
Total petroleum product inventories decreased (⬇) by 17.3 million barrels from the previous report week, up to 798.3 million barrels.
Total product demand increased (⬆) 1,489,000 barrels daily to 21.087 million barrels per day.
Gasoline stocks increased (⬆) 3.0 million barrels from the previous report week; total stocks are 248.9 million barrels.
Demand for gasoline increased (⬆) 216,000 barrels per day to 8.302 million barrels per day.
Distillate fuel oil stocks decreased (⬇) 5.0 million barrels from the previous report week; distillate stocks are at 124.0 million barrels. EIA reported national distillate demand at 4.506 million barrels per day during the report week, an increase (⬆) of 398,000 barrels daily.
Propane stocks fell (⬇) 7.9 million barrels from the previous report to 66.2 million barrels. The report estimated current demand at 1,978,000 barrels per day, an increase (⬆) of 401,000 barrels daily from the previous report week.
Natural Gas
One way to measure sentiment in the market is to look at the positioning of market participants. This can be measured by where net long (short) positions stand in relation to a particular time period. The most recent Commitment of Traders report from the CFTC shows that money managers now hold a net long position equivalent to 2,585 bcf which ranks in the 86th percentile of all weeks since 2010. This is a dramatic shift from early November when fund managers held a net short position of 384 bcf which was in the 21st percentile.
Production curtailments and record consumption by electricity generators have combined to reduce inventory surpluses but widespread announcements of increased drilling to boost production have not been forthcoming on calls with Wall Street analysts.
After reaching an intraday high price of $4.369 on January 13, 2025, the front-month natural gas futures contract sold off and reached an intraday low on January 31st at $2.990 MMBtu. This move generated a huge pulse of volatility as depicted by the flaring of the light blue Bollinger Bands indicator.
The dotted yellow circle highlights a unique feature of Bollinger Bands. When a move lower in price reaches such an extreme that the upper Bollinger Band starts to turn lower, it often coincides with the end of the down move.
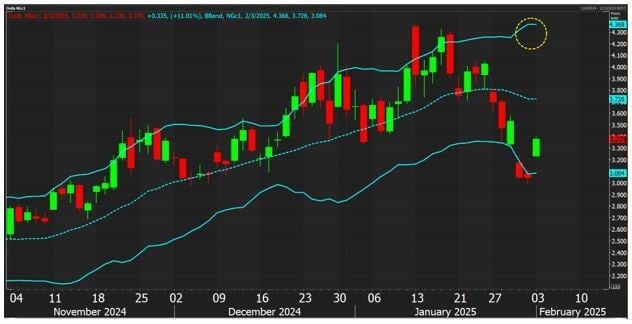
Source: LSEG
According to the EIA:
- Net withdrawals from storage totaled 321 Bcf for the week ended January 24, compared with the five-year (2020–24) average net withdrawals of 189 Bcf and last year’s net withdrawals of 234 Bcf during the same week. This is the fourth-largest withdrawal on record. Working natural gas stocks totaled 2,571 Bcf, which is 111 Bcf (4%) lower than the five-year average and 144 Bcf (5%) lower than last year at this time.
- According to The Desk survey of natural gas analysts, estimates of the weekly net change to working natural gas stocks ranged from net withdrawals of 298 Bcf to 340 Bcf, with a median estimate of 313 Bcf.
- The average rate of withdrawals from storage is 31% higher than the five-year average so far in the withdrawal season (November through March). If the rate of withdrawals from storage matched the five-year average of 12.5 Bcf/d for the remainder of the withdrawal season, the total inventory would be 1,749 Bcf on March 31, which is 111 Bcf lower than the five-year average of 1,860 Bcf for that time of year.
Was this helpful? We’d like your feedback.
Please respond to [email protected]
This material has been prepared by a sales or trading employee or agent of Powerhouse Brokers, LLC and is, or is in the nature of, a solicitation. This material is not a research report prepared by Powerhouse Brokers, LLC. By accepting this communication, you agree that you are an experienced user of the futures markets, capable of making independent trading decisions, and agree that you are not, and will not, rely solely on this communication in making trading decisions.
DISTRIBUTION IN SOME JURISDICTIONS MAY BE PROHIBITED OR RESTRICTED BY LAW. PERSONS IN POSSESSION OF THIS COMMUNICATION INDIRECTLY SHOULD INFORM THEMSELVES ABOUT AND OBSERVE ANY SUCH PROHIBITION OR RESTRICTIONS. TO THE EXTENT THAT YOU HAVE RECEIVED THIS COMMUNICATION INDIRECTLY AND SOLICITATIONS ARE PROHIBITED IN YOUR JURISDICTION WITHOUT REGISTRATION, THE MARKET COMMENTARY IN THIS COMMUNICATION SHOULD NOT BE CONSIDERED A SOLICITATION.
The risk of loss in trading futures and/or options is substantial and each investor and/or trader must consider whether this is a suitable investment. Past performance, whether actual or indicated by simulated historical tests of strategies, is not indicative of future results. Trading advice is based on information taken from trades and statistical services and other sources that Powerhouse Brokers, LLC believes are reliable. We do not guarantee that such information is accurate or complete and it should not be relied upon as such. Trading advice reflects our good faith judgment at a specific time and is subject to change without notice. There is no guarantee that the advice we give will result in profitable trades.
Copyright 2025 Powerhouse Brokers, LLC, All rights reserved