Still Watching What They Do (Not What They Say)
- U.S. and Russia open negotiations over war in Ukraine
- Sanctions regimes did little to reduce Russian oil production
- OPEC+ soon to be at another decision point on supply
- Resolution to the Ukraine war could have greater impact on natural gas
Sincerely,
David Thompson, CMT
Executive Vice President
Powerhouse
(202) 333-5380

The Matrix
The opening of direct talks between the U.S. and Russia on a resolution to the war in Ukraine has prompted consideration of the impact on oil prices. Treasury Secretary Bessent said that the U.S. is prepared to ratchet up or take down penalties on the Russian oil sector based on the progress of the negotiations. With significant sanctions already in place, the conversation has focused on the possibility of more Russian oil supply reaching the market.
Focusing on what countries and markets have actually done over the last several years reveals a different picture than is painted in the general press. While leaders in the West wanted to punish Russia’s aggression, they also wanted to avoid fanning the flames of post-COVID inflation. The post-invasion sanctions re-oriented the Russian energy trade rather than reduced it. While Russian oil output is lower now than pre-invasion, so too is that of Saudi Arabia and other OPEC+ members as a result of the cartel’s self-imposed output cuts.
A diplomatic resolution to the war in Ukraine is unlikely to result in an immediate return of Russian barrels to the market because they never left.
Another instance of ‘words vs. actions’ is the upcoming OPEC+ production decision. The cartel announced back in November 2024 that they would be bringing 2.2 million barrels/day of supply back to the market. They have delayed this action five times since then. The next decision point comes in April, but with international trade uncertainty weighing on oil demand growth it becomes difficult to see how OPEC+ will want to add more supply to an already soft demand picture.
Supply/Demand Balances
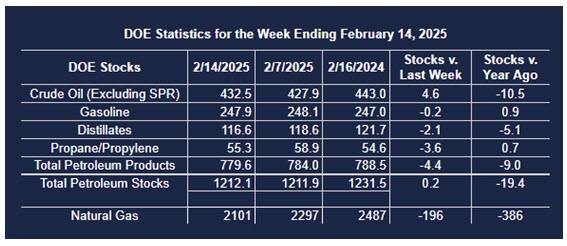
Supply/demand data in the United States for the week ended February 14, 2025, were released by the Energy Information Administration.
Total commercial stocks of petroleum increased (⬆) 0.2 million barrels to 1.2121 billion barrels during the week ended February 14th, 2025.
Commercial crude oil supplies in the United States were higher (⬆) by 4.6 million barrels from the previous report week to 432.5 million barrels.
Crude oil inventory changes by PAD District:
PADD 1: Down (⬇) 0.5 million barrels to 8.0 million barrels
PADD 2: Up (⬆) 3.1 million barrels to 105.8 million barrels
PADD 3: Up (⬆) 3.8 million barrels to 247.3 million barrels
PADD 4: Unchanged (=) at 24.7 million barrels
PADD 5: Down (⬇) 1.8 million barrels to 46.6 million barrels
Cushing, Oklahoma, inventories were up (⬆) 1.5 million barrels to 23.3 million barrels.
Domestic crude oil production increased (⬆) 3,000 barrels per day from the previous report at 13.497 million barrels per day.
Crude oil imports averaged 5.820 million barrels per day, a daily decrease (⬇) of 488,000 barrels. Exports increased (⬆) 472,000 barrels daily to 4.381 million barrels per day.
Refineries used 84.9% of capacity; a decrease (⬇) of 0.1% from the previous report week.
Crude oil inputs to refineries decreased (⬇) 15,000 barrels daily; there were 15.416 million barrels per day of crude oil run to facilities. Gross inputs, which include blending stocks, decreased (⬇) 6,000 barrels daily to 15.589 million barrels daily.
Total petroleum product inventories decreased (⬇) by 4.4 million barrels from the previous report week, up to 779.6 million barrels.
Total product demand increased (⬆) 29,000 barrels daily to 19.653 million barrels per day.
Gasoline stocks decreased (⬇) 0.2 million barrels from the previous report week; total stocks are 247.9 million barrels.
Demand for gasoline decreased (⬇) 338,000 barrels per day to 8.239 million barrels per day.
Distillate fuel oil stocks decreased (⬇) 2.1 million barrels from the previous report week; distillate stocks are at 116.6 million barrels. EIA reported national distillate demand at 4.364 million barrels per day during the report week, an increase (⬆) of 679,000 barrels daily.
Propane stocks fell (⬇) 3.6 million barrels from the previous report to 55.3 million barrels. The report estimated current demand at 1,322,000 barrels per day, a decrease (⬇) of 178,000 barrels daily from the previous report week.
Natural Gas
A negotiated solution of the Ukraine-Russia war could have more significant impact on the price of natural gas. While nearly all pipeline shipments of Russian gas to Europe have halted, some European countries continue to buy Russian LNG in record amounts. A diplomatic breakthrough could change the current perceptions on the political viability of Russian gas returning at scale to European markets. If this were to occur, the dramatic price disparity between the Dutch TTF benchmark and Henry Hub could narrow and U.S. LNG exports would face more competition.
According to the EIA:
Net withdrawals from storage totaled 196 Bcf for the week ended February 14, compared with the five-year (2020–24) average net withdrawals of 145 Bcf and last year’s net withdrawals of 58 Bcf during the same week. Working natural gas stocks totaled 2,101 Bcf, which is 118 Bcf (5%) lower than the five-year average and 386 Bcf (16%) lower than last year at this time.
According to The Desk survey of natural gas analysts, estimates of the weekly net change to working natural gas stocks ranged from net withdrawals of 173 Bcf to 215 Bcf, with a median estimate of 191 Bcf.
The average rate of withdrawals from storage is 22% higher than the five-year average so far in the withdrawal season (November through March). If the rate of withdrawals from storage matched the five-year average of 8 Bcf/d for the remainder of the withdrawal season, the total inventory would be 1,742 Bcf on March 31, which is 118 Bcf lower than the five-year average of 1,860 Bcf for that time of year.
Was this helpful? We’d like your feedback.
Please respond to [email protected]
This material has been prepared by a sales or trading employee or agent of Powerhouse Brokers, LLC and is, or is in the nature of, a solicitation. This material is not a research report prepared by Powerhouse Brokers, LLC. By accepting this communication, you agree that you are an experienced user of the futures markets, capable of making independent trading decisions, and agree that you are not, and will not, rely solely on this communication in making trading decisions.
DISTRIBUTION IN SOME JURISDICTIONS MAY BE PROHIBITED OR RESTRICTED BY LAW. PERSONS IN POSSESSION OF THIS COMMUNICATION INDIRECTLY SHOULD INFORM THEMSELVES ABOUT AND OBSERVE ANY SUCH PROHIBITION OR RESTRICTIONS. TO THE EXTENT THAT YOU HAVE RECEIVED THIS COMMUNICATION INDIRECTLY AND SOLICITATIONS ARE PROHIBITED IN YOUR JURISDICTION WITHOUT REGISTRATION, THE MARKET COMMENTARY IN THIS COMMUNICATION SHOULD NOT BE CONSIDERED A SOLICITATION.
The risk of loss in trading futures and/or options is substantial and each investor and/or trader must consider whether this is a suitable investment. Past performance, whether actual or indicated by simulated historical tests of strategies, is not indicative of future results. Trading advice is based on information taken from trades and statistical services and other sources that Powerhouse Brokers, LLC believes are reliable. We do not guarantee that such information is accurate or complete and it should not be relied upon as such. Trading advice reflects our good faith judgment at a specific time and is subject to change without notice. There is no guarantee that the advice we give will result in profitable trades.
Copyright 2025 Powerhouse Brokers, LLC, All rights reserved