A Rally In a Bear Market?
- ULSD futures top resistance could reach $1.84; refinery issues limit product supply
- Global economic situation inhibited by Covid-19 coronavirus — eats into demand
- Longer-term North American supply abundant — crude oil production around 18 million barrels daily
- Natural gas support at $1.73

The Matrix
The outlook for petroleum prices remains generally bearish. Weakness in the near term is attributed to Covid-19, the coronavirus that has inhibited demand in China and is now being experienced elsewhere.
The International Energy Agency (IEA) is expecting a decline in first quarter petroleum demand, the first drop since the 2009 financial crisis. IEA expects the loss of 435,000 barrels daily globally versus last year. The Agency assumes a steady return to normal through the third quarter. It puts annual growth for 2020 at 825,000 daily barrels. A growth rate this low has not been seen since 2011.
Crude oil production in North America seems unstoppable as U.S. output returns to 13 million barrels daily, another bearish indicator. Canadian supply is running around 5.3 million barrels per day.
Mexico, once a major producer, has suffered from regulatory overreach and industrial stagnation. Production is now estimated to be only 1.8 million barrels daily – half its 2005 level. Energy reforms enacted in 2013 were intended to encourage private investment, create expertise and provide competition for Pemex, Mexico’s highly inefficient national oil company.
Mexico’s current AMLO administration has not embraced these initiatives. Auctions for exploration and production have been reduced and existing contracts with private investors are under review. But the potentials for significant new supply cannot be ignored. The country is estimated to have about 60 billion deep-water barrels and 50 billion barrels of shale oil. Mexico’s next leadership, due in 2024, may reverse the current attitude and make these barrels available to the market.
The production situation for North America over the next several decades is likely to support non-OPEC supply and limit price increases. One important indicator of this strength is the growth in exports. The United States exported over 3 million barrels daily last year. Preparations for added exports are already under way and have been well reported.
Oil consumption patterns have been shifting toward Asia. The International Energy Agency forecasts India’s demand for oil will reach six million barrels per day by 2024. India used 4.4 million barrels daily in 2017. India is becoming a key oil demand source. The country does not have significant crude oil production. India will become “even more exposed to risks of supply disruptions, geopolitical uncertainties, and the volatility of oil prices.”
Supply/Demand Balances
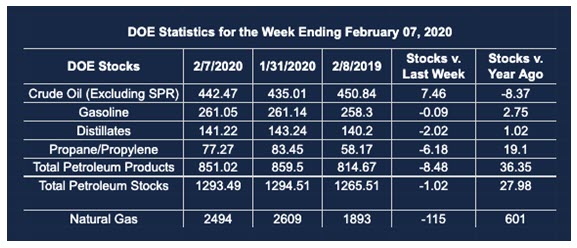
Supply/demand data in the United States for the week ending Feb. 7, 2020, were released by the Energy Information Administration.
Total commercial stocks of petroleum fell by 1.0 million barrels during the week ending Feb. 7, 2020.
Commercial crude oil supplies in the United States increased by 7.5 million barrels from the previous report week to 442.5 million barrels.
Crude oil inventory changes by PAD District:
PADD 1: Plus 1.4 million barrels to 10.9 million barrels
PADD 2: Plus 0.8 million barrels to 127.7 million barrels
PADD 3: Plus 2.8 million barrels to 229.3 million barrels
PADD 4: Down 0.2 million barrels to 21.6 million barrels
PADD 5: Plus 2.7 million barrels to 53.0 million barrels
Cushing, Oklahoma inventories up 1.7 million barrels from the previous report week to 38.4 million barrels.
Domestic crude oil production rose 100,000 barrels per day from the previous report week to 13.0 million barrels daily.
Crude oil imports averaged 6.978 million barrels per day, a daily increase of 363,000 barrels. Exports fell 443,000 barrels daily to 2.970 million barrels per day.
Refineries used 88.0 percent of capacity, up 0.6% from the previous report week.
Crude oil inputs to refineries increased 48,000 barrels daily; there were 16.020 million barrels per day of crude oil run to facilities. Gross inputs, which include blending stocks, rose 100,000 barrels daily to reach 16.545 million barrels daily.
Total petroleum product inventories fell 8.5 million barrels from the previous report week.
Gasoline stocks decreased 0.1 million barrels daily from the previous report week; total stocks are 261.0 million barrels.
Demand for gasoline fell 211,000 barrels per day to 8.722 million barrels per day.
Total product demand increased 133,000 barrels daily to 20.968 million barrels per day.
Distillate fuel oil stocks decreased 2.0 million barrels from the previous report week; distillate stocks are at 141.2 million barrels. EIA reported national distillate demand at 3.820 million barrels per day during the report week, a decrease of 391,000 barrels daily.
Propane stocks decreased 6.2 million barrels from the previous report week; propane stocks are 77.3 million barrels. The report estimated current demand at 2.090 million barrels per day, an increase of 848,000 barrels daily from the previous report week.
Natural Gas
Natural gas futures prices are being pressured lower, notwithstanding colder weather. Technical analysis suggests support around $1.73. An objective below that support level could be $1.10.
According to EIA:
The net withdrawal [of natural gas] from storage totaled 115 Bcf for the week ending February 7, compared with the five-year (2015–19) average net withdrawal of 131 Bcf and last year’s net withdrawal of 101 Bcf during the same week. Working natural gas stocks totaled 2,494 Bcf, which is 215 Bcf more than the five-year average and 601 Bcf more than last year at this time.
The average rate of withdrawal from storage is 13% lower than the five-year average so far in the withdrawal season (November through March). If the rate of withdrawal from storage matched the five-year average of 11 Bcf/d for the remainder of the withdrawal season, the total inventory would be 1,912 Bcf on March 31, which is 215 Bcf higher than the five-year average of 1,697 Bcf for that time of year.
Futures trading involves significant risk and is not suitable for everyone. Transactions in securities futures, commodity and index futures and options on future markets carry a high degree of risk. The amount of initial margin is small relative to the value of the futures contract, meaning that transactions are heavily “leveraged”. A relatively small market movement will have a proportionately larger impact on the funds you have deposited or will have to deposit: this may work against you as well as for you. You may sustain a total loss of initial margin funds and any additional funds deposited with the clearing firm to maintain your position. If the market moves against your position or margin levels are increased, you may be called upon to pay substantial additional funds on short notice to maintain your position. If you fail to comply with a request for additional funds within the time prescribed, your position may be liquidated at a loss and you will be liable for any resulting deficit. Past performance may not be indicative of future results. This is not an offer to invest in any investment program.
Powerhouse is a registered affiliate of Coquest, Inc.
Was this helpful? We’d like your feedback.
Please respond to [email protected]
Copyright © 2020 Powerhouse, All rights reserved.