Crude Oil Prices Advance
- Russia cuts production in March
- Administration rhetoric on oil & gas shifts
- US production growth slows
- Natural gas prices go flat
Sincerely,
Alan Levine, Chairman
Powerhouse
(202) 333-5380
The Matrix
Spot futures prices for WTI crude oil gained $5.60 last week – an increase in value of 7.6%. Spot WTI settled at $79.72 on Friday. The move did not bring prices above the range in which they’d been trading since early December – a move over $82.65 would be needed for that – but it highlighted several events that followed imposition of limits on Russian petroleum exports. They could be seen as bullish for price.
Russia announced a half-million barrels daily cut in oil production for March, after price caps were imposed on Russian oil by the EU and the United States. Russia imposed this cut unilaterally, but apparently had informal discussions with OPEC+. This is reminiscent of similar efforts by OPEC to support price by withholding supply. It also might be a reaction to challenges the country faces finding new outlets for its oil.
The press to move away from oil and natural gas got pushback from President Biden’s State of The Union address. The urgency to create green energy has caused investments in fossil fuel development to fall. Rig counts have fallen, and refiners are moving away from petroleum to renewable feedstocks. But the transition has lagged. Concerns about available supply are growing, despite EIA projections of flattening domestic demand. In his address, Biden now concedes the importance of oil and natural gas to the economy.
The EIA’s Short Term Energy Outlook calls for crude oil production to build nearly 600,000 barrels daily in 2023 to 12.5 million barrels per day. Another 160,000 daily barrels could be added in 2024. The gain, however, would be slowed by rising production costs, lower reserves, and investor pressure to cut exploration and production spending. EIA expects demand to stay flat at 20.3 million barrels per day, but the net effect is likely to move prices higher as higher interest rates add to costs.
Supply/Demand Balances
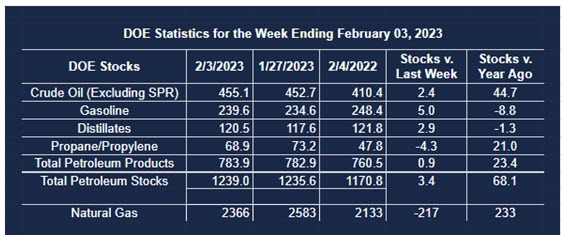
Supply/demand data in the United States for the week ended February 3, 2023, were released by the Energy Information Administration.
Total commercial stocks of petroleum rose (⬆) 3.4 million barrels to 1.239 billion barrels during the week ended February 3, 2023.
Commercial crude oil supplies in the United States increased (⬆) by 2.4 million barrels from the previous report week to 455.1 million barrels.
Crude oil inventory changes by PAD District:
PADD 1: Down (⬇) 1.0 million barrels to 7.5 million barrels
PADD 2: Plus (⬆) 1.7 million barrels to 125.1 million barrels
PADD 3: Down (⬇) 0.4 million barrels to 248.6 million barrels
PADD 4: Down (⬇) 0.3 million barrels to 24.7 million barrels
PADD 5: Plus (⬆) 2.4 million barrels to 49.2 million barrels
Cushing, Oklahoma, inventories were up (⬆) 1.1 million barrels from the previous report week to 39.1 million barrels.
Domestic crude oil production was up 100,000 (⬆) from the previous report week at 12.3 million barrels daily.
Crude oil imports averaged 7.058 million barrels per day, a daily decrease (⬇) of 225,000 barrels. Exports decreased 592,000 barrels daily to 2.900 million barrels per day.
Refineries used 87.9% of capacity; 2.2 percentage points higher (⬆) than the previous report week.
Crude oil inputs to refineries increased (⬆) 448,000 barrels daily; there were 15.410 million barrels per day of crude oil run to facilities. Gross inputs, which include blending stocks, rose (⬆) 397,000 barrels daily to 15.836 million barrels daily.
Total petroleum product inventories rose (⬆) by 1.0 million barrels from the previous report week, rising to 783.9 million barrels.
Total product demand increased (⬆) 430,000 barrels daily to 20.536 million barrels per day.
Gasoline stocks increased (⬆) 5.0 million barrels from the previous report week; total stocks are 239.6 million barrels.
Demand for gasoline decreased (⬇) 62,000 barrels per day to 8.428 million barrels per day.
Distillate fuel oil stocks increased (⬆) 2.9 million barrels from the previous report week; distillate stocks are at 120.5 million barrels. EIA reported national distillate demand at 3.762 million barrels per day during the report week, an increase (⬆) of 69,000 barrels daily.
Propane stocks decreased (⬇) by 4.3 million barrels from the previous report week to 68.9 million barrels. The report estimated current demand at 1.853 million barrels per day, an increase (⬆) of 371,000 barrels daily from the previous report week.
Natural Gas
Henry Hub natural gas spot futures have flatlined around $2.50 over the past two weeks. Last week, we discussed an analysis that found natural gas markets have spent 5 ½% of that time below $2.50 (excluding the Pandemic period.) The reluctance of prices to move below that level may reflect that history. Why there has been no evidence of futures traders moving in at this level is another matter.
Events on the ground may help explain the situation.
In Europe, the European Union has been able to meet demand and is receiving new LNG cargoes. The graphic indicates that the EU target of 80% has been exceeded; 83.5% of EU gas storage is filled.
The drama surrounding the Freeport, Texas LNG export facility may be coming to an end. The company has asked FERC to allow loading to start loading ships for export. Freeport has also been given permission to produce LNG in its third liquefaction train.
Immediate market reaction was bullish. Prices rose on NYMEX, but not enough to break the flat pattern we have described.
Freeport is able, reportedly, to convert 2.1 Bcf/d of natural gas into LNG. But the plant is not expected to reach full capacity for another month or so. This could continue weak fundamentals for some time yet.
According to the EIA:
Net [natural gas] withdrawals from storage totaled 217 Bcf for the week ended February 3, compared with the five-year (2018–2022) average net withdrawals of 171 Bcf and last year’s net withdrawals of 228 Bcf during the same week. Working natural gas stocks totaled 2,366 Bcf, which is 117 Bcf (5%) more than the five-year average and 233 Bcf (11%) more than last year at this time.
The average rate of withdrawals from storage is 16% lower than the five-year average so far in the withdrawal season (November through March). If the rate of withdrawals from storage matched the five-year average of 12.8 Bcf/d for the remainder of the withdrawal season, the total inventory would be 1,649 Bcf on March 31, which is 117 Bcf higher than the five-year average of 1,532 Bcf for that time of year.
Was this helpful? We’d like your feedback.
Please respond to [email protected]
Powerhouse Futures & Trading Disclaimer
Copyright 2023 Powerhouse Brokerage, LLC, All rights reserved