

Buy the Rumor; Sell the Fact
- ULSD futures prices fell about $0.25 cents last week
- Nearby support for ULSD around $2.61
- Candlestick bars show directional uncertainty
- Natural gas pipeline capacity grew in 2021.

Alan Levine—Chairman, Powerhouse
(202) 333-5380
The Matrix
President’s Day week has opened on an uncertain note. Presidents Biden and Putin announced a final effort at a diplomatic solution to the Ukraine crisis face-to-face. Less than a day later, Russia sent its troops into already separatist regions of the country. It seems the world is into a new kind of Cold War with diplomatic and military elements vying for supremacy.
It is not clear whether the United States is calling this an “invasion.” To do so could require the imposition of sanctions. Sanctions are likely to focus on economic activity between the separatist regions and the European Union. They could also limit Russian access to Western European capital markets.
This Weekly Energy Market Situation was written before the latest ratcheting up. It focuses on the technical aspects of trading and chart analysis. It’s notable how prescient technical analysis might be.
The inevitable correction in the long rallies of ULSD and WTI oil futures began last week. The more interesting reaction occurred in ULSD. Prices topped on Monday, February 14, reaching $2.966 per barrel. By Friday, spot futures tested $2.7147 before ended the week at $2.7815.
In one week, prices retraced 50% of nearby support at $2.61. And $2.61 itself is nearly a 40% retracement of the total move in ULSD spot futures that began early in December at $2.01.
The pattern of action for each day of the week, shown in candlestick bars, suggests some of the analytical problems facing traders who simply want to know, “Where’s next?”
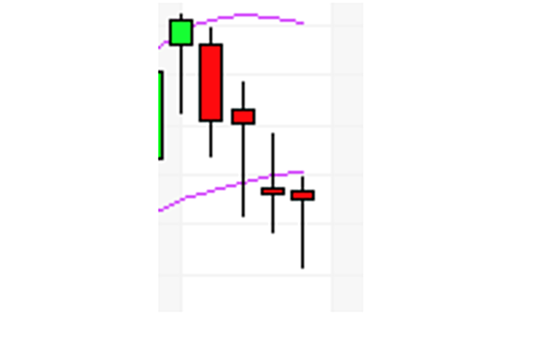
ULSD Daily Prices Week Ended Feb 18, 2022. Source: Morgan Stanley
Note: Candlesticks for each day show the daily range at the ends of each bar. The oblong box (the “body”) shows the opening and closing of each day. The color of the box indicates a higher (green) close or a lower (red) daily close.
What is particularly interesting about last week’s pattern is that by Wednesday, the bars become elongated, but the bodies shrink. The longer bars suggest uncertainty among traders, unsure of where value lies. The smaller bodies represent open and closing prices near each other. For all the day’s labor, markets show little change of direction, a sign of uncertainty.
The bears’ uncertainty has already appeared in week one of the selloff–after many weeks during which the bulls clearly held the whip hand.
Powerhouse has discussed the ramifications of the United States’ threats of sanctions. These include limits on Russian oil exports and inhibiting Russian access to global payment systems.
Finally, nothing in last week’s price action has changed long-term Elliott Wave projections. They continue to point higher, with a reprise of $125 for WTI crude oil and $3.50 for spot ULSD.
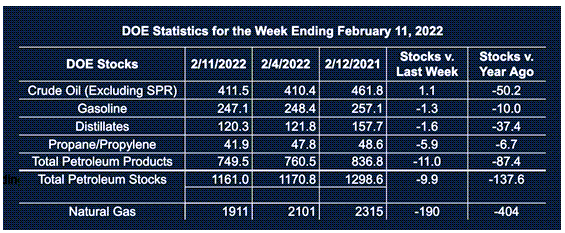
Supply/Demand Balances
Supply/demand data in the United States for the week ended Feb.11, 2022, were released by the Energy Information Administration.
Total commercial stocks of petroleum fell 9.9 million barrels during the week ended Feb. 11, 2022.
Commercial crude oil supplies in the United States increased by 1.1 million barrels from the previous report week to 411.5 million barrels.
Crude oil inventory changes by PAD District:
PADD 1: Down 0.2 million barrels to 7.2 million barrels
PADD 2: Down 2.9 million barrels to 105.8 million barrels
PADD 3: Plus 4.1 million barrels to 224.8 million barrels
PADD 4: Plus 0.1 million barrels to 23.6 million barrels
PADD 5: Down 0.2 million barrels to 50 million barrels
Cushing, Oklahoma, inventories were down 1.9 million barrels from the previous report week to 25.8 million barrels.
Domestic crude oil production was unchanged from the previous report week at 11.6 million barrels daily.
Crude oil imports averaged 5.790 million barrels per day, a daily decrease of 599,000 barrels. Exports decreased 829,000 barrels daily to 2.271 million barrels per day.
Refineries used 85.3% of capacity; 2.9 percentage points lower from the previous report week.
Crude oil inputs to refineries decreased 675,000 barrels daily; there were 14.902 million barrels per day of crude oil run to facilities. Gross inputs, which include blending stocks, fell 527,000 barrels daily to 15.460 million barrels daily.
Total petroleum product inventories fell 11 million barrels from the previous report week.
Gasoline stocks decreased 1.3 million barrels from the previous report week; total stocks are 247.1 million barrels.
Demand for gasoline fell by 556,000 barrels per day to 8.570 million barrels per day.
Total product demand increased 860,000 barrels daily to 22.741 million barrels per day.
Distillate fuel oil stocks decreased 1.6 million barrels from the previous report week; distillate stocks are at 120.3 million barrels. EIA reported national distillate demand at 4.321 million barrels per day during the report week, an increase of 25,000 barrels daily.
Propane stocks decreased 5.9 million barrels from the previous report week; propane stocks are at 41.9 million barrels. The report estimated current demand at 2.067 million barrels per day, a decrease of 39,000 barrels daily from the previous report week.
Natural Gas
Natural gas’s long-term place in America’s energy independence was supported by 2021’s additions to pipeline capacity. EIA says that 7.44Bcf/d were added to capacity available. This was the lowest addition to interstate capacity since 2016.
The gain was nonetheless significant. It represents support for growing export demand by improving connectivity between interstate pipes and LNG export facilities. Over 5 Bcf/d of the gain was in the South-Central states, including Louisiana and Texas.
Another 1.6 Bcf/d of capacity were added in the Northeast. This reflected greater takeaway from the Appalachian Basin, supporting East Coast demand.
According to the EIA:
The net withdrawals from storage totaled 190 Bcf for the week ended February 11, compared with the five-year (2017–2021) average net withdrawals of 154 Bcf and last year’s net withdrawals of 227 Bcf during the same week. Working natural gas stocks totaled 1,911 Bcf, which is 251 Bcf lower than the five-year average and 404 Bcf lower than last year at this time.
The average rate of withdrawals from storage is 9% higher than the five-year average so far in the withdrawal season (November through March). If the rate of withdrawals from storage matched the five-year average of 10.3 Bcf/d for the remainder of the withdrawal season, the total inventory would be 1,415 Bcf on March 31, which is 251 Bcf lower than the five-year average of 1,666 Bcf for that time of year.
Was this helpful? We’d like your feedback.
Please respond to [email protected]
Powerhouse Futures & Trading Disclaimer
Copyright 2021 Powerhouse Brokerage, LLC, All rights reserved


