The Beat Goes On–Oil Prices Advance Again
- Diesel futures prices have tracked the 2007/08 period closely
- OPEC+ production falls short
- Refinery executives cite bullish effects of ‘capacity rationalization’
- Natural gas withdrawals 8% higher than the five-year average but cold weather fails to sustain

Alan Levine—Chairman, Powerhouse
(202) 333-5380
The Matrix
Morgan Stanley analysts published an interesting note last week highlighting how diesel prices (specifically European gasoil) have been tracing a pattern very similar to the course of the market back in 2007/08. They note that the catalyst in 7/08 was an exceedingly tight supply situation. While Morgan does not call a repeat of the 7/08 scenario during which U.S. diesel prices surpassed $4/gal their base case, several fundamental factors do point to a tight inventory situation in coming months.
A senior executive at Valero stated during an earnings conference call that he, “does not expect those drawn diesel inventories to be restocked soon due to industry rationalization.” In addition, Valero forecasts jet consumption to recover to about 80% of pre-pandemic level at the end of 2022, up from 60% at the start of the year. The executive defined industry rationalization as reduced refining capacity, post-COVID.
The CEO and Executive VP of Refining of Phillips 66 echoed the industry rationalization theme in their own earnings call. Additionally, P66 cited extensive spring refinery turnarounds ahead.
The executives said that the need to conserve cash caused most refiners to delay as much maintenance as possible over the last two years. As the EVP of Refining said, “But now those things are coming due. You can’t do that forever. For us, this year it’s pretty heavy across the system, and I suspect we are not the only ones that you’re going to see that.”
Fourteen of the nineteen OPEC+ group produced less than quota in December, lagging their target by more than 800,000 barrels per day. January data, soon to be released, are not likely to be much better. Morgan Stanley reports that exports for the core OPEC group fell in January by nearly 300,000 daily barrels in the face of a higher monthly output quota.
The decline in January supply likely represents falling Iraqi Basra loadings, and challenges to four Libyan fields and the Es Sider export terminal. Exports from Iran, Venezuela, Angola and Algeria also reduced the supply of crude oil.
The strength of prices has not abated, despite contrarian suggestions that new sources of crude oil supply are on their way. Among them is the Permian Basin which could add as much as 900,000 barrels per day in 2022. Iranian/U.S. talks to renew the nuclear deal could open the possibility of full Iranian market participation. Higher prices could also pressure OPEC members to pump more.
The Russia-Ukraine situation will dominate energy markets in the short-term. The West is holding its cards close, but concerns include sanctions on Russian oil exports. Ironically, this could force prices even higher, supporting the higher-for-longer price thesis. Sanctions could also exclude Russia from global payment mechanisms, inhibiting repayment of Russian debt and potentially damaging global economic interests.
Supply/Demand Balances
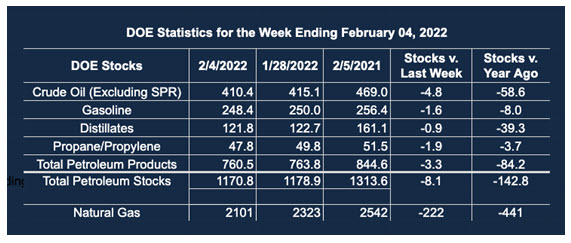
Supply/demand data in the United States for the week ended Feb. 4, 2022, were released by the Energy Information Administration.
Total commercial stocks of petroleum fell 8.1 million barrels during the week ended Feb. 4, 2022.
Commercial crude oil supplies in the United States decreased by 4.8 million barrels from the previous report week to 410.4 million barrels.
Crude oil inventory changes by PAD District:
PADD 1: Down 0.7 million barrels to 7.4 million barrels
PADD 2: Down 2.8 million barrels to 108.7 million barrels
PADD 3: Down 1.5 million barrels to 220.7 million barrels
PADD 4: Plus 0.1 million barrels to 23.5 million barrels
PADD 5: Plus 0.3 million barrels to 50.2 million barrels
Cushing, Oklahoma, inventories were down 2.8 million barrels from the previous report week to 27.7 million barrels.
Domestic crude oil production was up 100,000 per day from the previous report week to 11.6 million barrels daily.
Crude oil imports averaged 6.389 million barrels per day, a daily decrease of 696,000 barrels. Exports increased 724,000 barrels daily to 3.1 million barrels per day.
Refineries used 88.2% of capacity; 1.5 percentage points higher from the previous report week.
Crude oil inputs to refineries increased 329,000 barrels daily; there were 15.577 million barrels per day of crude oil run to facilities. Gross inputs, which include blending stocks, rose 273,000 barrels daily to 15.987 million barrels daily.
Total petroleum product inventories fell 3.3 million barrels from the previous report week.
Gasoline stocks decreased 1.6 from the previous report week; total stocks are 248.4 million barrels.
Demand for gasoline rose by 900,000 barrels per day to 9.126 million barrels per day.
Total product demand increased 470,000 barrels daily to 21.881 million barrels per day.
Distillate fuel oil stocks decreased 0.9 million barrels from the previous report week; distillate stocks are at 121.8 million barrels. EIA reported national distillate demand at 4.296 million barrels per day during the report week, a decrease of 373,000 barrels daily.
Propane stocks decreased 1.9 million barrels from the previous report week; propane stocks are at 47.8 million barrels. The report estimated current demand at 2.106 million barrels per day, an increase of 181,000 barrels daily from the previous report week.
Natural Gas
The rally in the February natural gas futures contract has not been sustained. A brief flirtation with $5.57 has collapsed and last week ended at $3.96. Weather always matters, but nothing on the horizon now suggests a resurgence of a substantial rally. Several weeks remain before the Spring shoulder season arrives with moderate temperatures. Much colder weather will be required to move the natural gas futures market higher at this point in the season. Significant support remains around $3.6.
According to the EIA:
The net withdrawals from storage totaled 222 Bcf for the week ended February 4, compared with the five-year (2017–2021) average net withdrawals of 150 Bcf and last year’s net withdrawals of 174 Bcf during the same week. Working natural gas stocks totaled 2,101 Bcf, which is 215 Bcf lower than the five-year average and 441 Bcf lower than last year at this time.
The average rate of withdrawals from storage is 8% higher than the five-year average so far in the withdrawal season (November through March). If the rate of withdrawals from storage matched the five-year average of 11.8 Bcf/d for the remainder of the withdrawal season, the total inventory would be 1,451 Bcf on March 31, which is 215 Bcf lower than the five-year average of 1,666 Bcf for that time of year.
Was this helpful? We’d like your feedback.
Please respond to [email protected]
Powerhouse Futures & Trading Disclaimer
Copyright 2021 Powerhouse Brokerage, LLC, All rights reserved