A 10 Million Barrel Crude Oil Draw Without a Rally
- Prices and data diverge
- Many factors in play
- Exports showing heft
- Natural gas prices in a wedge

Alan Levine—Chairman, Powerhouse
(202) 333-5380
The Matrix
Prices of crude oil traded as futures are strongly influenced by market fundamentals. Data on petroleum demand and supply are critical to planning for production, net imports, and inventory. (Technical analysis is also widely used. It depends on price action and patterns directly. It is not part of this note.)
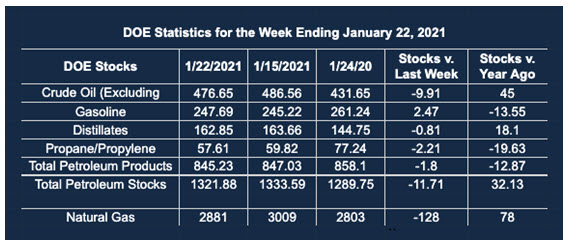
The latest report on the U.S. petroleum balance was released on Wednesday, January 27, 2021, by the U.S. Energy Administration (EIA.) It was based on data for the week ending January 22, 2021. The weekly report lists many useful fundamentals but data on inventories of crude oil attract immediate, actionable information.
Last week EIA said that stocks of commercial crude oil (excluding oil in the Strategic Petroleum Reserve) were 476.7 million barrels. This represented 10 million fewer barrels in storage than during the previous week. This was a substantial drop in supplies in a market that showed demand essentially flat from the prior week.
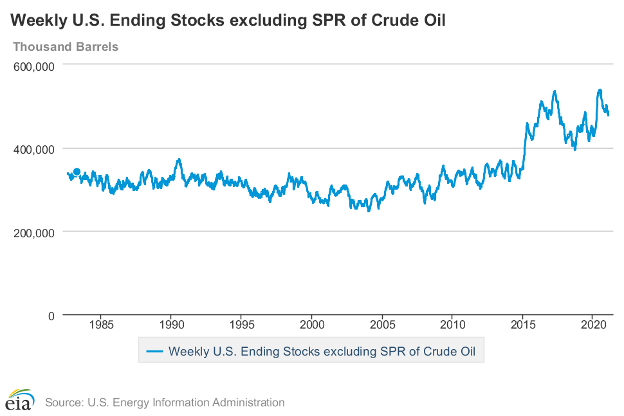
Crude Oil Stocks (excl. SPR) 1982 – 2021
A weekly reduction of 10 million barrels is not the largest weekly draw ever seen. It is, nonetheless, a substantial loss of supply which should, cause prices to move higher. In context, Powerhouse examined weekly reductions in inventory since 1982. This 38-year period has around 2,000 weeks. Last week’s reduction of 10 million barrels was the 34th largest decline recorded.
WTI crude oil futures did not react as one might expect. When EIA released the inventory data at 10:30 a.m., spot (March) WTI was trading at $52.53 and within an hour reached a high at $53.30. Subsequently, prices lost momentum, settling at $52.85. Other factors were at work, too.
Inventory declines appeared in each PADD, (the Rockies were a small exception.) The Gulf Coast had the largest drop, 6.4 million barrels. This was attributable to heavy fog in the Houston Ship Canal delaying off loadings. The Midwest lost 2.7 million barrels of inventory. PADD 2 supplies are about half of Gulf Coast stores, making the Midwest supply situation even more uncertain. PADD 5, the West Coast, contributed a half-million reduction to the national reduction of inventory.
Another factor to be considered is the change in imports. Both the Midwest and the Gulf Coast experienced declines in imports greater than 500,000 barrels daily.
Exports are a more recent fundamental with which analysts are dealing. Nationally, crude oil exports reached 3.4 million barrels daily, a weekly gain of 1.1 million barrels per day.
Put together, the loss of inventory reflected several factors that resulted in a price drop. Prices have not broken support.
By the way, the largest inventory decline recorded by EIA since 1982 occurred on January 1, 1999. It was a drop of 15 million barrels for the week, leaving supply at 305.7 million barrels.
Supply/Demand Balances
Supply/demand data in the United States for the week ended January 22, 2021, were released by the Energy Information Administration.
Total commercial stocks of petroleum fell by 11.7 million barrels during the week ended January 22, 2021.
Commercial crude oil supplies in the United States decreased by 9.9 million barrels from the previous report week to 476.7 million barrels.
Crude oil inventory changes by PAD District:
PADD 1: Down 0.3 million barrels to 11.3 million barrels
PADD 2: Down 2.7 million barrels to 137.0 million barrels
PADD 3: Down 6.4 million barrels to 256.6 million barrels
PADD 4: Plus 0.1 million barrels to 24.3 million barrels
PADD 5: Down 0.5 million barrels to 47.5 million barrels
Cushing, Oklahoma inventories were down 2.3 million barrels from the previous report week to 50.2 million barrels.
Domestic crude oil production was down 100,000 per day from the previous report week to 10.9 million barrels daily.
Crude oil imports averaged 5.064 million barrels per day, a daily decrease of 981,000 barrels. Exports increased 1,104,000 barrels daily to 3.355 million barrels per day.
Refineries used 81.7% of capacity, down 0.8% from the previous report week.
Crude oil inputs to refineries decreased 39,000 barrels daily; there were 14.721 million barrels per day of crude oil run to facilities. Gross inputs, which include blending stocks, fell 150,000 barrels daily to 15.024 million barrels daily.
Total petroleum product inventories fell 1.8 million barrels from the previous report week.
Gasoline stocks increased 2.5 million barrels daily from the previous report week; total stocks are 476.7 million barrels.
Demand for gasoline fell 279,000 barrels per day to 7.833 million barrels per day.
Total product demand increased 39,000 barrels daily to 19.681 million barrels per day.
Distillate fuel oil stocks decreased 0.8 barrels from the previous report week; distillate stocks are at 162.8 million barrels. EIA reported national distillate demand at 4.300 million barrels per day during the report week, an increase of 479,000 barrels daily.
Propane stocks decreased 2.2 million barrels from the previous report week; propane stocks are 57.6 million barrels. The report estimated current demand at 1.588 million barrels per day, a decrease of 291,000 barrels daily from the previous report week.
Natural Gas
Natural gas spot futures tried once again to attack resistance without success. Prices for the week of January 22 settled at $2.446. They opened the next week a dime higher but could not break above $2.77, a significant failure of resistance.
Natural gas prices have developed another pattern since bottoming at $1.432 – a significant low late in June, 2020. They topped at $3.393 early in November. Since then prices have moved in decreasing ranges. Last week’s price failure then, was part of prices being squeezed over the past several months.
Such a pattern suggests not only that when prices break, a powerful expansion may follow, testing a low of $2.20 or retesting $3.40.
The net [natural gas] withdrawals from storage totaled 128 Bcf for the week ending January 22, compared with the five-year (2016–2021) average net withdrawals of 174 Bcf and last year’s net withdrawals of 170 Bcf during the same week. Working natural gas stocks totaled 2,881 Bcf, which is 244 Bcf more than the five-year average and 78 Bcf more than last year at this time.
The average rate of withdrawals from storage is 4% lower than the five-year average so far in the withdrawal season (November through March). If the rate of withdrawals from storage matched the five-year average of 12.2 Bcf/d for the remainder of the withdrawal season, the total inventory would be 2,050 Bcf on March 31, which is 244 Bcf higher than the five-year average of 1,806 Bcf for that time of year.
Was this helpful? We’d like your feedback.
Please respond to [email protected]
Powerhouse Futures & Trading Disclaimer
Copyright 2021 Powerhouse Brokerage, LLC, All rights reserved