Energy Prices, Economic Direction Send Confused Signals
- Oil prices reach new lows
- Price lows for oil products nearby?
- Embargoes and crude oil price caps to start
- Recovery in natural gas prices hangs in the balance.
Sincerely,
Alan Levine, Chairman
Powerhouse
(202) 333-5380
The Matrix
Petroleum product futures prices fell to new lows last week. ULSD settled at $3.17. ULSD prices are threatening support at $3.13. But meteorological winter has arrived and winter demand lies ahead.
RBOB ended the week at $2.84. RBOB last traded at this level at the start of 2022. The technical situation for RBOB is similar to that of distillates. Key support is found close by at the $2.28 level, last seen in early September. The RBOB market may be near its seasonal low and ready to move into spring and the 2023 driving season.
This comfortable, predictable annual scenario may feel good. Unpredictable global geopolitics and domestic economics are introducing major unknowns into the equation.
Today, December 5, the European Union and the UK scheduled the start of an embargo on Russian crude oil. At the same time, the G7 nations and Australia will impose a price cap on Russian crude oil.
The cap will stand at $60 per barrel. It will allow non-EU countries to import Russian oil. It will prohibit shipping, insurance and re-insurance companies from handling Russian cargoes unless sold at a price lower than the cap. There remain many unresolved questions, including whether the cap would replace the embargo.
The American economy has also offered mixed signals for business interests.
Inflation is imposing its own tax. Efforts to fight high prices have frustrated the Federal Reserve. It remains intent on constraining inflation, but is reportedly considering easing the rate of its interest tightening.
Fears of recession are headline news. But employment continues to grow apace. November saw nonfarm payrolls adding 263,000 jobs and wages on the increase. And this was despite significant layoffs in the technology sector.
Supply/Demand Balances
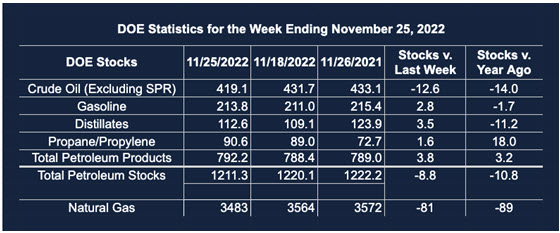
Supply/demand data in the United States for the week ended November 25, 2022, were released by the Energy Information Administration.
Total commercial stocks of petroleum fell (⬇) 8.8 million barrels to 1.211 billion barrels during the week ended November 25, 2022.
Commercial crude oil supplies in the United States decreased (⬇) by 12.6 million barrels from the previous report week to 419.1 million barrels.
Crude oil inventory changes by PAD District:
PADD 1: Down (⬇) 0.6 million barrels to 8.0 million barrels
PADD 2: Down (⬇) 2.0 million barrels to 106.5 million barrels
PADD 3: Down (⬇) 11.1 million barrels to 230.1 million barrels
PADD 4: Plus (⬆) 0.1 million barrels to 25.0 million barrels
PADD 5: Plus (⬆) 0.9 million barrels to 49.4 million barrels
Cushing, Oklahoma inventories were down (⬇) 0.4 million barrels from the previous report week to 24.3 million barrels.
Domestic crude oil production was unchanged from the previous report week at 12.1 million barrels daily.
Crude oil imports averaged 6.037 million barrels per day, a daily decrease (⬇) of 1.027 million barrels. Exports increased (⬆) 706,000 barrels daily to 4.948 million barrels per day.
Refineries used 95.2% of capacity; 1.3 percentage points higher (⬆) than the previous report week.
Crude oil inputs to refineries increased (⬆) 228,000 barrels daily; there were 16.638 million barrels per day of crude oil run to facilities. Gross inputs, which include blending stocks, rose (⬆) 243,000 barrels daily to 17.106 million barrels daily.
Total petroleum product inventories rose (⬆) by 3.8 million barrels from the previous report week, rising to 792.2 million barrels.
Total product demand decreased (⬇) 160,000 barrels daily to 19.717 million barrels per day.
Gasoline stocks increased (⬆) 2.8 million barrels from the previous report week; total stocks are 213.8 million barrels.
Demand for gasoline decreased (⬇) 9,000 barrels per day to 8.317 million barrels per day.
Distillate fuel oil stocks increased (⬆) 3.5 million barrels from the previous report week; distillate stocks are at 112.6 million barrels. EIA reported national distillate demand at 3.656 million barrels per day during the report week, a decrease (⬇) of 190,000 barrels daily.
Propane stocks increased (⬆) by 1.6 million barrels from the previous report week to 90.6 million barrels. The report estimated current demand at 910,000 barrels per day, an increase (⬆) of 36,000 barrels daily from the previous report week.
Natural Gas
Eighty-one Bcf of natural gas were drawn from underground storage in EIA’s most recent weekly report. This reflected a sharp increase in Heating Degree Days for the week ended November 24. Critical gas consuming states of the Middle Atlantic produce 42 more HDDs than normal. Similar results were experienced in New England and the East North Central states.
This impetus for demand was not reflected in natural gas futures prices during last week’s trading. Spot futures fell throughout the week, from a Tuesday high of $7.42/MM/Btu to their Friday settle, $6.28. The recent high, $7.60, was reached during the previous week. Prices fell more than 17%. Prices could hold nearby at $6.13; more important support lies below around $5.75.
A recovery in price hangs in the balance. Storage in underground caverns is only 2% below relevant averages and weather predictions for December tend mild.

DOE’s Natural Gas Weekly Update for the week ended November 30 reported “dry natural gas production grew by 0.5% (0.5 Bcf/d), and average net imports from Canada decreased by 18.4% (1.2 Bcf/d) from last week.”
Freeport, Louisiana export facilities are not expected to resume LNG production until year-end or even later. But this gas now faces a European Union with about 90% of its storage full. And prices have been trading in a very wide range topping at $9.75.
According to the EIA:
Net withdrawals [of natural gas} from storage totaled 81 Bcf for the week ended November 25, compared with the five-year (2017–2021) average net withdrawals of 34 Bcf and last year’s net withdrawals of 54 Bcf during the same week. Working natural gas stocks totaled 3,483 Bcf, which is 86 Bcf (2%) lower than the five-year average and 89 Bcf (2%) lower than last year at this time.
Was this helpful? We’d like your feedback.
Please respond to [email protected]
Powerhouse Futures & Trading Disclaimer
Copyright 2022 Powerhouse Brokerage, LLC, All rights reserved