Technical Indicator for Diesel Signals Possible Downtrend Exhaustion
- All price trends eventually come to an end
- Momentum indicators can help assess trend changes
- ULSD now showing signs of bullish technical divergence
- Solid fundamentals driving natural gas futures prices
Sincerely,
David Thompson, CMT
Executive Vice President
Powerhouse
(202) 333-5380
The Matrix
One of the most well-known trading aphorisms is “the trend is your friend”. And for those market participants who have been bearishly positioned in ULSD futures, this has certainly been true since mid-November. However, it’s important to know that the old saying has a second part that states, “until it bends at the end”.
A divergence between the performances of a technical indicator and the market price can herald the beginning of the bend at the end. This is why traders pay close attention to momentum indicators such as the Relative Strength Index (RSI). The RSI measures average gains versus average losses over a given period to assess the magnitude of
recent price changes. Technical divergence occurs, for example, in a downtrend when the futures price makes a new low, but the RSI does not. This can indicate that the most recent push lower in price has not occurred with the same intensity of prior selloffs.
ULSD futures are currently in the process of displaying this type of bullish divergence as shown in the chart below.

A few other technical conditions need to be satisfied before we can say the trend has definitively changed from bearish to bullish. The front-month ULSD futures contract must close convincingly above resistance at $2.1941 and open interest should be increasing on up days.
The previous edition of The Weekly Energy Market Situation spoke to business considerations that might prompt buying interest. This technical assessment may provide objective evidence that market participants are beginning to change their opinions on the diesel market.
Supply/Demand Balances
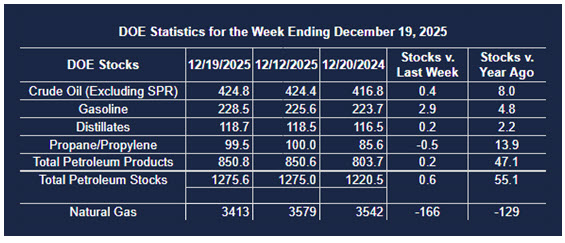
Supply/demand data in the United States for the week ending December 19, 2025, were released by the Energy Information Administration.
Total commercial stocks of petroleum increased (⬆) 0.7 million barrels to 1.2756 billion barrels during the week ending December 19th, 2025.
Commercial crude oil supplies in the United States were higher (⬆) by 0.4 million barrels from the previous report week to 424.8 million barrels.
Crude oil inventory changes by PAD District:
PADD 1: Down (⬇) 0.4 million barrels to 7.4 million barrels
PADD 2: Up (⬆) 2.2 million barrels to 104.3 million barrels
PADD 3: Down (⬇) 0.6 million barrels to 241.1 million barrels
PADD 4: Down (⬇) 0.5 million barrels to 24.7 million barrels
PADD 5: Down (⬇) 0.3 million barrels to 47.3 million barrels
Cushing, Oklahoma, inventories inventories were up (⬆) 0.7 million barrels to 21.6 million barrels.
Domestic crude oil production decreased (⬇) 18,000 barrels per day from the previous report to 13.825 million barrels per day.
Crude oil imports averaged 6.086 million barrels per day, a daily decrease (⬇) of 440,000 barrels. Exports decreased (⬇) 1,048,000 barrels daily to 3.616 million barrels per day.
Refineries used 94.6 percent of capacity; a decrease (⬇) of 0.2 percent from the previous report week.
Crude oil inputs to refineries decreased (⬇) 212,000 barrels daily; there were 16.776 million barrels per day of crude oil run to facilities. Gross inputs, which include blending stocks, decreased (⬇) 34,000 barrels daily to 17.175 million barrels daily.
Total petroleum product inventories increased (⬆) by 0.2 million barrels from the previous report week, up to 850.8 million barrels.
Total product demand decreased (⬇) 263,000 barrels daily to 20.310 million barrels per day.
Gasoline stocks increased (⬆) 2.9 million barrels from the previous report week; total stocks are 228.5 million barrels.
Demand for gasoline decreased (⬇) 136,000 barrels per day to 8.942 million barrels per day.
Distillate fuel oil stocks increased (⬆) 0.2 million barrels from the previous report week; distillate stocks are at 118.7 million barrels. EIA reported national distillate demand at 4.156 million barrels per day during the report week, an increase (⬆) of 369,000 barrels daily.
Propane stocks fell (⬇) by 0.5 million barrels to 99.5 million barrels. The report estimated current demand at 910,000 barrels per day, an decrease (⬇) of 271,000 barrels daily from the previous report week.
Natural Gas
Good old-fashioned fundamentals are supporting the most recent strength in natural gas futures prices.
Nationwide temperatures are expected to drop from now through January 13th according to several meteorologists. Financial firm LSEG projects average gas demand in the lower 48 states, including exports, will move higher from 137.1 bcfd this week to 138 bcfd next week, an increase from its earlier projections.
In addition, the average gas flows to the eight large U.S. LNG export facilities climbed to 18.5 billion cubic feet per day (bcfd) so far in December, exceeding November’s record of 18.2 bcfd.
LSEG said average natural gas output in the lower 48 U.S. states climbed to 110.1 billion cubic feet per day in December, surpassing November’s monthly record of 109.6 bcfd.
According to the EIA:
- Net withdrawals from storage totaled 167 Bcf for the week ending December 12, compared with the five-year (2020–24) average net withdrawals of 96 Bcf and last year’s net withdrawals of 134 Bcf during the same week. Working natural gas stocks totaled 3,579 Bcf, which is 32 Bcf (1%) more than the five-year average and 61 Bcf (2%) lower than last year at this time. Current inventories in the East and Midwest natural gas storage regions are about 5% under the five-year average.
Was this helpful? We’d like your feedback.
Please respond to [email protected]
This material has been prepared by a sales or trading employee or agent of Powerhouse Brokers, LLC and is, or is in the nature of, a solicitation. This material is not a research report prepared by Powerhouse Brokers, LLC. By accepting this communication, you agree that you are an experienced user of the futures markets, capable of making independent trading decisions, and agree that you are not, and will not, rely solely on this communication in making trading decisions.
DISTRIBUTION IN SOME JURISDICTIONS MAY BE PROHIBITED OR RESTRICTED BY LAW. PERSONS IN POSSESSION OF THIS COMMUNICATION INDIRECTLY SHOULD INFORM THEMSELVES ABOUT AND OBSERVE ANY SUCH PROHIBITION OR RESTRICTIONS. TO THE EXTENT THAT YOU HAVE RECEIVED THIS COMMUNICATION INDIRECTLY AND SOLICITATIONS ARE PROHIBITED IN YOUR JURISDICTION WITHOUT REGISTRATION, THE MARKET COMMENTARY IN THIS COMMUNICATION SHOULD NOT BE CONSIDERED A SOLICITATION.
The risk of loss in trading futures and/or options is substantial and each investor and/or trader must consider whether this is a suitable investment. Past performance, whether actual or indicated by simulated historical tests of strategies, is not indicative of future results. Trading advice is based on information taken from trades and statistical services and other sources that Powerhouse Brokers, LLC believes are reliable. We do not guarantee that such information is accurate or complete and it should not be relied upon as such. Trading advice reflects our good faith judgment at a specific time and is subject to change without notice. There is no guarantee that the advice we give will result in profitable trades.