Economic Outlook Holds Contradictions
- Inflation apparently slowing
- Fed raises rates again
- Natural gas prices have lost more than $2.00 per MMBtu in the past two weeks.
Sincerely,
Alan Levine, Chairman
Powerhouse
(202) 333-5380
The Matrix
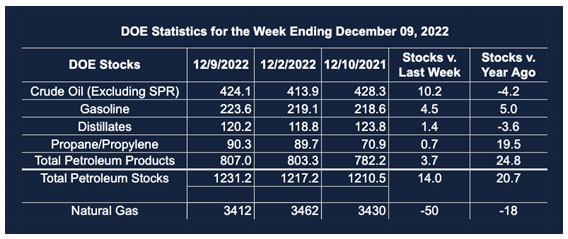
DOE’s Weekly Supply/Demand Balance for the week ended December 16 could only be read as bullish for prices. Sharp weekly declines in crude oil stocks, (-5.9 million barrels) and about the same among products, (-5.6 million barrels) led to a mid-week rally that advanced through the balance of last week.
The outlook for the economy as 2022 winds down is fraught with mixed signals among the things that create economic activity.
Inflation has been the biggest story of the year, but the Consumer Price Index gained only 0.2% in November. This was the smallest gain reported in the past 15 months. Easing prices comes while the Federal Reserve has initiated several increases in interest rates. The Fed’s latest increase was somewhat attenuated. Slower gains in interest rates and the latest CPI data suggest the strategy may be bearing fruit.
Inflation is a hidden tax on everyone’s pocketbook. The improvement in the situation for consumers from slower inflation growth can be seen in improved “real” gross domestic product increases in the fourth quarter. The Atlanta Federal Reserve Bank estimates that Real GDP this quarter will be more than 3%. (“Real” is the economists’ way to eliminate the effect of inflation on current, (nominal,) reported GDP.)
Gasoline prices at the pump were a major story this year too. Prices reached $5 per gallon in some markets. They have since retreated, evidenced by the spot NY Harbor RBOB futures ended last week at $2.38. This was a substantial weekly gain of 12.3 cents, but still well below the June high of $4.326.
The decline in gasoline prices reflects several factors. U.S. refineries have been running near capacity. The situation in Ukraine, while still perilous, has turned against Russia. The European Union has imposed new limits on Russian exports and the instability they engender. The United States initiated a significant drawdown in the Strategic Petroleum Reserve.
This could bring 2023 into a new, bullish commodities “Supercycle.” Powerhouse’s Weekly Energy Market Situation will examine this phenomenon in our first Report of 2023.
Supply/Demand Balances
Supply/demand data in the United States for the week ended December 16, 2022, were released by the Energy Information Administration.
Total commercial stocks of petroleum fell 11.8 million barrels to 1.220 billion barrels during the week ended December 16, 2022.
Commercial crude oil supplies in the United States decreased (⬇) by 5.9 million barrels from the previous report week to 418.2 million barrels.
Crude oil inventory changes by PAD District:
PADD 1: Down (⬇) 1.0 million barrels to 7.5 million barrels
PADD 2: Plus (⬆) 0.2 million barrels to 106.0 million barrels
PADD 3: Down (⬇) 4.6 million barrels to 230.7 million barrels
PADD 4: Plus (⬆) 0.2 million barrels to 25.0 million barrels
PADD 5: Down (⬇) 0.8 million barrels to 48.9 million barrels
Cushing, Oklahoma, inventories were up (⬆) 0.8 million barrels from the previous report week to 25.2 million barrels.
Domestic crude oil production was UNCH from the previous report week at 12.1 million barrels daily.
Crude oil imports averaged 5.819 million barrels per day, a daily decrease (⬇) of 1.048 million barrels. Exports increased (⬆) 44,000 barrels daily to 4.360 million barrels per day.
Refineries used 90.9% of capacity; 1.3 percentage points lower (⬇) than the previous report week.
Crude oil inputs to refineries decreased (⬇) 150,000 barrels daily; there were 15.976 million barrels per day of crude oil run to facilities. Gross inputs, which include blending stocks, fell (⬇) 231,000 barrels daily to 16.383 million barrels daily.
Total petroleum product inventories rose (⬇) by 5.7 million barrels from the previous report week, rising to 801.4 million barrels.
Total product demand increased (⬆) 968,000 barrels daily to 20.924 million barrels per day.
Gasoline stocks increased (⬆) 2.5 million barrels from the previous report week; total stocks are 226.1 million barrels.
Demand for gasoline increased (⬆) 459,000 barrels per day to 8.714 million barrels per day.
Distillate fuel oil stocks decreased (⬇) 0.2 million barrels from the previous report week; distillate stocks are at 119.9 million barrels. EIA reported national distillate demand at 4.015 million barrels per day during the report week, a increase (⬆) of 247,000 barrels daily.
Propane stocks decreased (⬇) by 2.9 million barrels from the previous report week to 87.4 million barrels. The report estimated current demand at 1.727 million barrels per day, an increase (⬆) of 610,000 barrels daily from the previous report week.
Natural Gas
The Natural Gas Weekly Update for the week ended December 21, 2022, reported fewer net withdrawals from storage than expected by industry observers. But spot futures prices for Henry Hub fell dramatically. Support at $5.00 barely held. Prices have lost more than $2.00 per MMBtu in the past two weeks, reflecting expectations of more temperate weather returning post-Christmas.
According to the EIA:
Net withdrawals [of natural gas] from storage totaled 87 Bcf for the week ended December 16, compared with the five-year (2017–2021) average net withdrawals of 124 Bcf and last year’s net withdrawals of 60 Bcf during the same week. Working natural gas stocks totaled 3,325 Bcf, which is 22 Bcf (1%) more than the five-year average and 45 Bcf (1%) lower than last year at this time.
Was this helpful? We’d like your feedback.
Please respond to [email protected]
Powerhouse Futures & Trading Disclaimer
Copyright 2022 Powerhouse Brokerage, LLC, All rights reserved


