Tis’ the Season(al)
- Petroleum prices decline in line with historic seasonal trends
- OPEC+ continues adding supply to the market
- Low stocks of crude oil and petroleum products worrisome
- U.S. to become world’s largest LNG exporter
Sincerely,
Elaine Levin, President
Powerhouse
(202) 333-5380
The Matrix
It is not uncommon for most petroleum prices to weaken during the fourth quarter. Despite historically low inventories, 2021’s sell-off started right on cue. Prices for crude oil and distillate hit their high price for the year in October, following the typical seasonal pattern. Gasoline prices also topped in October, which is uncommon given the September specification change to cheaper winter-grade gasoline.
A trio of bearish stories were the catalyst for the sell-off. But there are still bullish fundamentals that bear watching.
Last week, OPEC+ surprised by agreeing to continue their planned monthly increase of 400,000 bpd. Many believed there would be a pause after the U.S. and other large consuming nations pledged to release barrels from strategic reserves. The discovery of the new COVID-19 variant Omicron hit prices hard the week before the meeting. Further demand uncertainty was another reason for the group to reconsider adding more supply to the market. It is worth noting the meeting concluded with an unusual step. By leaving the meeting “in session,” a change could quickly be made before the January meeting if developments from the pandemic warrant.
OPEC+ may be responding to political pressures from the U.S. and others. Another motive might be the increase could be just enough to keep the U.S. shale producers from responding with higher production. Or they could be signaling that demand is there for the additional barrels.
The seasonal pattern suggests that prices should bottom during the first quarter of 2022. What could turn the tide?
- As of writing, there have been no reported deaths from the newly discovered variant. Symptoms reported thus far have been milder than Delta. Vaccine effectiveness is still unknown, but anecdotal evidence does suggest at least some protection. While it is early, good news about to the pandemic has been bullish for prices.
- Global stocks are low. The following chart show reportable global inventories of crude oil and petroleum products. Current inventory levels are well below the 5-year average.
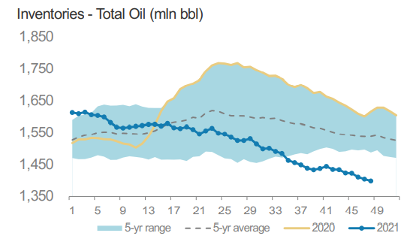
Crude and Petroleum Products Inventories 5-year Trend Analysis – 2016-2021 Source: Morgan Stanley Research, EIA, PJK International, IE Singapore, PAJ, Genscape, FEDCom/Platts
- Global inventories of coal and natural gas are also low. This week, the Wall Street Journal reported that U.S. power plants are low on coal stockpiles. Reuters reports, “Japanese refiners are dusting off unused supply chains for fuel oil and getting coastal vessels and storage tanks ready after receiving requests from electric utilities to supply more fuel oil this winter amid a global crunch for power generation fuels.” If coal and natural gas are unavailable for power generation, utilities can turn to diesel for backup.
Although December is forecasted to be mild, there is a lot of winter left. A January/February cold snap could also turn the market, which would be right on time.
Supply/Demand Balances
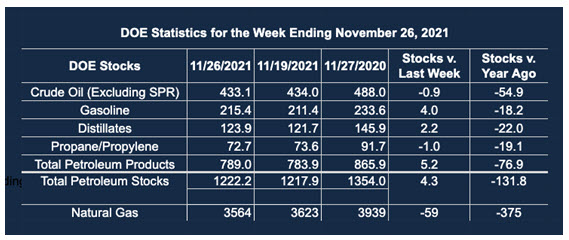
Supply/demand data in the United States for the week ended Nov. 26, 2021, were released by the Energy Information Administration.
Total commercial stocks of petroleum rose 4.3 million barrels during the week ended Nov. 26, 2021.
Commercial crude oil supplies in the United States decreased by 0.9 million barrels from the previous report week to 433.1 million barrels.
Crude oil inventory changes by PAD District:
PADD 1: Plus 0.2 million barrels to 9.1 million barrels
PADD 2: Plus 2.5 million barrels to 113.3 million barrels
PADD 3: Down 2.8 million barrels to 237.2 million barrels
PADD 4: Down 0.2 million barrels to 23.6 million barrels
PADD 5: Down 0.6 million barrels to 50 million barrels
Cushing, Oklahoma, inventories were up 0.9 million barrels from the previous report week to 28.5 million barrels.
Domestic crude oil production was up 100,000 barrels per day from the previous report week to 11.6 million barrels daily.
Crude oil imports averaged 6.604 million barrels per day, a daily increase of 168,000 barrels. Exports increased 99,000 barrels daily to 2.704 million barrels per day.
Refineries used 88.8% of capacity; 0.2 percentage points higher from the previous report week.
Crude oil inputs to refineries decreased 9,000 barrels daily; there were 15.631 million barrels per day of crude oil run to facilities. Gross inputs, which include blending stocks, rose 37,000 barrels daily to 16.095 million barrels daily.
Total petroleum product inventories rose 5.2 million barrels from the previous report week.
Gasoline stocks increased 4 from the previous report week; total stocks are 215.4 million barrels.
Demand for gasoline fell by 538,000 barrels per day to 8.796 million barrels per day.
Total product demand decreased 1.530 million barrels daily to 20.222 million barrels per day.
Distillate fuel oil stocks increased 2.2 million barrels from the previous report week; distillate stocks are at 123.9 million barrels. EIA reported national distillate demand at 4.209 million barrels per day during the report week, a decrease of 182,000 barrels daily.
Propane stocks decreased 1 million barrels from the previous report week; propane stocks are at 72.7 million barrels. The report estimated current demand at 1.673 million barrels per day, an increase of 49,000 barrels daily from the previous report week.
Natural Gas
The U.S. began shipping liquified natural gas to the world in 2016. Our low-cost shale gas is in high demand across the globe. New LNG liquefaction units, also known as trains, were added rapidly. By 2020, only Australia and Qatar were exporting more LNG. Next year, the U.S. will become the world’s largest exporter with the addition of new trains at Sabine Pass and a new export facility at Calcasieu Pass, Louisiana. According to the EIA, the U.S. will have base load capacity to export 11.4 Bcf per day (with peak capacity of 13.9 Bcf/d) by 2022. Construction of new facilities continues, and with the completion of Golden Pass in Texas, the U.S. will have peak export capacity of an estimated 16.3 Bcf/d. Natural gas is now a global commodity. Events and weather outside North America are more and more critical to prices at home.
According to the EIA:
Working gas in storage was 3,564 Bcf as of Friday, Nov. 26, 2021, according to EIA estimates. This represents a net decrease of 59 Bcf from the previous week. Stocks were 375 Bcf less than last year at this time and 86 Bcf below the five-year average of 3,650 Bcf. At 3,564 Bcf, total working gas is within the five-year historical range.
Was this helpful? We’d like your feedback.
Please respond to [email protected]
Powerhouse Futures & Trading Disclaimer
Copyright 2021 Powerhouse Brokerage, LLC, All rights reserved