Energy Prices Soften
- ULSD buyers could get a bonus
- Distillate fuel oil stocks remain below average
- The invasion of Kuwait 34 years ago still reverberates
- Natural gas data are bearish
Sincerely
Al Levine, Chair
Powerhouse
(202) 333-5380
The Matrix
Spot futures prices for ULSD have been moving lower since the beginning of July when they topped around $2.66. Trading now around $2.30, a reduction in the value of about 13.5 percent represents a low not seen in over a year. Prices are closing on $2.15, the low of early May 2023.
Companies seeking to establish length in winter ULSD could benefit from opening positions now. (Winter ULSD is trading now at $2.33, basis January 2025.) Prices are even below those reached in the first quarter when many buyers typically start to establish next-winter positions.
Inventories of distillate fuel oil have remained below their average for the past five years. They have been rising since April. Nonetheless, weather patterns are changing. La Nina and potential hurricane activity this summer could rapidly alter the situation.
You can’t outthink the market. Use this opportunity to develop winter positions and benefit from currently low prices for price caps and fixed price offerings.
Last Friday, August 2, was the thirty-fourth anniversary of a watershed event in global affairs and in energy futures trading.
Saddam Hussein, president of Iraq, invaded Kuwait. His aim was to obtain Kuwait’s oil reserves, erase a large debt owed by Iraq to Kuwait, and expand Iraq’s influence in the Middle East. The attack on Kuwait was the opening shot of the first Gulf War, which did not end until February 1991.
Subsequently, other nations were drawn into regional conflict. The United States led a coalition into the Gulf War, which caused great damage to personnel and property in the region.
The United States has become the largest producer of crude oil. Altered patterns of international commerce have developed.
Futures markets today have changed markedly. In 1990, the U.S. market had less than a handful of liquid energy futures contracts. Today, sixty-five listed futures (or options on futures) contracts have open interest of greater than 5,000 contracts on CME. This number expands when adding in the ICE exchange. Companies can now hedge propane futures, both Mt. Belvieu and Conway, Gulf Coast ULSD basis, ethanol, environmental credits and scores of natural gas basis contracts. What has not changed is the volatile nature of energy pricing. Thankfully, today’s risk managers have a much more robust toolbox to work with.
Supply/Demand Balances
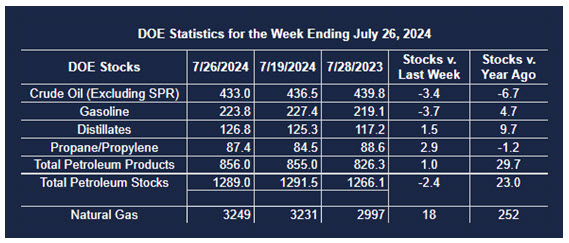
Supply/demand data in the United States for the week ending July 26, 2024, were released by the Energy Information Administration.
Total commercial stocks of petroleum decreased (⬇) 2.4 million barrels to 1.289 billion barrels during the week ending July 26, 2024.
Commercial crude oil supplies in the United States were lower (⬇) by 3.4 million barrels from the previous report week to 433 million barrels.
Crude oil inventory changes by PAD District:
PADD 1: Down (⬇) 0.4 million barrels to 7.3 million barrels
PADD 2: Down (⬇) 1.1 million barrels to 111 million barrels
PADD 3: Down (⬇) 4.1 million barrels to 242.8 million barrels
PADD 4: Up (⬆) 0.4 million barrels to 22.9 million barrels
PADD 5: Up (⬆) 1.7 million barrels to 47.4 million barrels
Cushing, Oklahoma, inventories were down (⬇) 1.1 million barrels to 29.9 million barrels.
Domestic crude oil production was unchanged (=) at 13.3 million barrels per day.
Crude oil imports averaged 6.953 million barrels per day, a daily increase (⬆) of 82,000 barrels. Exports increased (⬆) 733,000 barrels daily to 4.919 million barrels per day.
Refineries used 90.1 percent of capacity; 1.5 percentage points less (⬇) than the previous report week.
Crude oil inputs to refineries decreased (⬇) 257,000 barrels daily; there were 16.150 million barrels per day of crude oil run to facilities. Gross inputs, which include blending stocks, decreased (⬇) 267,000 barrels daily to 16.520 million barrels daily.
Total petroleum product inventories increased (⬆) by 1 million barrels from the previous report week, up to 856 million barrels.
Total product demand decreased (⬇) 310,000 barrels daily to 20.724 million barrels per day.
Gasoline stocks decreased (⬇) 3.6 million barrels from the previous report week; total stocks are 223.8 million barrels.
Demand for gasoline decreased (⬇) 206,000 barrels per day to 9.250 million barrels per day.
Distillate fuel oil stocks increased (⬆) 1.5 million barrels from the previous report week; distillate stocks are at 126.8 million barrels. EIA reported national distillate demand at 3.725 million barrels per day during the report week, a decrease (⬇) of 136,000 barrels daily.
Propane stocks rose (⬆) 2.9 million barrels from the previous report to 87.4 million barrels. The report estimated current demand at 716,000 barrels per day, an decrease (⬇) of 302,000 barrels daily from the previous report week.
Natural Gas
Spot natural gas Henry Hub futures settled the week ending August 2 at $1.967 per MMBtus. This marked seven out of the past eight weeks with a lower close since prices peaked at $3.159.
It also conflicts with record-setting heat in the United States. The EIA notes that 6.9 million MWh per day of electricity were generated on July 9, 2024, in the lower 48 states, “probably the most in history and certainly since at least January 1, 2019, when [EIA] began to collect hourly data about natural gas generation.” The contradiction between low prices and strong demand exists partly because of domestic production, which has been growing steadily for fourteen years, satisfying much of our expanding natural gas requirements.
By 2023, domestic natural gas production had reached 37.9 billion Mcf cubic feet (103.8 MMcf/d). For the week ending July 31, marketed production reached 115.8 MMcf/d. Strong demand for natural gas has not translated into higher prices. As noted, prices have been falling for seven out of the last eight weeks, with a new low found last week. In fact, prices are approaching $1.60, a support level we have been watching for some time.
The CME has produced a chart of daily volume and open interest for natural gas since July 12. Open interest, the number of contacts active in the market, has generally moved higher, suggesting that shorts are holding their contracts as prices fall. After several days of steady trading, volume has also taken off, moving from about 118,000 contracts daily on July 29 to 122,000 trades last Friday. The rising volume and rising open interest, while prices are falling, can be taken as bearish for the market. This expectation is still in force.
According to the EIA:
- Net injections into storage totaled 18 Bcf for the week ending July 26, compared with the five-year (2019–2023) average net injections of 33 Bcf and last year’s net injections of 15 Bcf during the same week. Working natural gas stocks totaled 3,249 Bcf, which is 441 Bcf (16%) more than the five-year average and 252 Bcf (8%) more than last year at this time.
- According to The Desk survey of natural gas analysts, estimates of the weekly net change to working natural gas stocks ranged from net injections of 20 Bcf to 45 Bcf, with a median estimate of 29 Bcf.
- The average rate of injections into storage is 16% lower than the five-year average so far in the refill season (April through October). If the rate of injections into storage matched the five-year average of 9.3 Bcf/d for the remainder of the refill season, the total inventory would be 4,153 Bcf on October 31, which is 441 Bcf higher than the five-year average of 3,712 Bcf for that time of year.
Was this helpful? We’d like your feedback.
Please respond to [email protected]
This material has been prepared by a sales or trading employee or agent of Powerhouse Brokers, LLC and is, or is in the nature of, a solicitation. This material is not a research report prepared by Powerhouse Brokers, LLC. By accepting this communication, you agree that you are an experienced user of the futures markets, capable of making independent trading decisions, and agree that you are not, and will not, rely solely on this communication in making trading decisions.
DISTRIBUTION IN SOME JURISDICTIONS MAY BE PROHIBITED OR RESTRICTED BY LAW. PERSONS IN POSSESSION OF THIS COMMUNICATION INDIRECTLY SHOULD INFORM THEMSELVES ABOUT AND OBSERVE ANY SUCH PROHIBITION OR RESTRICTIONS. TO THE EXTENT THAT YOU HAVE RECEIVED THIS COMMUNICATION INDIRECTLY AND SOLICITATIONS ARE PROHIBITED IN YOUR JURISDICTION WITHOUT REGISTRATION, THE MARKET COMMENTARY IN THIS COMMUNICATION SHOULD NOT BE CONSIDERED A SOLICITATION.
The risk of loss in trading futures and/or options is substantial and each investor and/or trader must consider whether this is a suitable investment. Past performance, whether actual or indicated by simulated historical tests of strategies, is not indicative of future results. Trading advice is based on information taken from trades and statistical services and other sources that Powerhouse Brokers, LLC believes are reliable. We do not guarantee that such information is accurate or complete and it should not be relied upon as such. Trading advice reflects our good faith judgment at a specific time and is subject to change without notice. There is no guarantee that the advice we give will result in profitable trades.