

Ultra Low Sulfur Diesel Finding New Uses
- ULSD now 95% of distillate fuel pool
- ULSD weather sensitive — expecting warm, wet winter
- Weather insurance can cover non-price risks to margin
- Natural gas injection lower than 5-year average for 8th consecutive week.

The Matrix
Distillate fuel oil has experienced a significant shift in its uses. 2004 was the first year EIA reported data on distillate fuel oil by sulfur content. In that year, the U.S. used 4.1 million barrels daily of distillate fuel oil. Low Sulfur fuel comprised 72.2 per cent of the total volume. ULSD was about one per cent of the total. By 2017, the total amount of distillate fuel oil, 3.9 million barrels daily, was little changed from 2004’s total, but more than 95 per cent was ULSD, containing less than 15 ppm. This sharp change reflects growing applications in transportation and imposition of lower sulfur fuel requirements even for residential use for home heating.
Notwithstanding the fuels’ sulfur content, its use, and to some degree its price, depends on weather expectations. Forecasts are being issued earlier and earlier in the year. This year, Powerhouse published a forecast featuring a weak El Niño, above normal Sea Surface Temperatures and a quiet solar cycle with lower sunspot activity. (Weekly Energy Situation, June 22, 2018)

Source: Old Farmer’s Almanac 2019
Comes now the Old Farmer’s Almanac (not to be confused with the Farmer’s Almanac, its long-time competitor.) Many meteorologists trivialize the OFA’s weather forecast, viewing it as unserious. Nonetheless its historical record holds up very well against many others. OFA’s projection favors a warmer winter for most of the country. The Atlantic coast states look to experience wetter weather as well.
How should oil dealers react to the uncertainty presented by these data? There are many tools now available to fashion a defense against an uncertain winter. Futures and options on futures, are the first tool of choice.
Futures and options on futures protect against prices moving against the dealer. Protecting the price of fuel itself may not fully protect against risk; price risk may not reflect volume risk. Dealers could consider the use of weather instruments. The loss of heating degree days is central to the loss of profits. Failure to generate heating degree days can now be offset by weather hedging.
Supply/Demand Balances
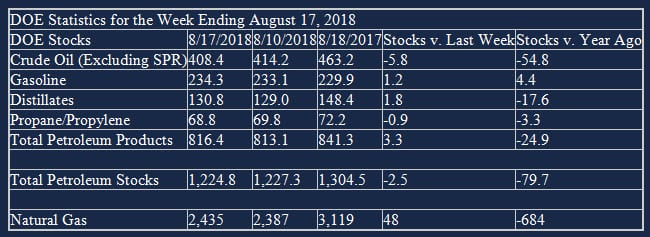
Supply/Demand Balances Supply/demand data in the United States for the week ending August, 17 2018 were released by the Energy Information Administration.
Total commercial stocks of petroleum fell 2.5 million barrels during the week ending August 17, 2018.
There were builds in stocks of gasoline, fuel ethanol, K-jet fuel, distillate fuel oil, and other oils. There were draws in stocks of residual fuel and propane.
Commercial crude oil supplies in the United States decreased to 408.4 million barrels, a draw of 5.8 million barrels. Crude oil supplies decreased in three of the five PAD Districts. PAD District 1 (East Coast) crude oil stocks fell 0.4 million barrels, PADD 3 (Gulf Coast) crude stocks declined 4.1 million barrels, and PADD 5 (West Coast) stocks retreated 2.0 million barrels. PAD District 2 (Midwest) stocks rose 0.6 million barrels and PADD 4 (Rockies) stocks increased 0.3 million barrels.
Cushing, Oklahoma inventories increased 0.8 million barrels from the previous report week to 24.2 million barrels.
Domestic crude oil production rose 100,000 barrels per day in the last report week to 11.000 million barrels per day.
Crude oil imports averaged 7.518 million barrels per day, a daily decrease of 1.496 million barrels per day. Exports decreased 437,000 barrels daily to 1.155 million barrels per day.
Refineries used 98.1 per cent of capacity, unchanged from the previous report week.
Crude oil inputs to refineries increased 1,000 barrels daily; there were 17.892 million barrels per day of crude oil run to facilities. Gross inputs, which include blending stocks, fell 7,000 barrels daily to 18.236 million barrels daily.
Total petroleum product inventories saw an increase of 3.3 million barrels from the previous report week.
Gasoline stocks increased 1.2 million barrels from the previous report week; total stocks are 234.3 million barrels.
Demand for gasoline decreased 59,000 barrels per day to 9.453 million barrels per day.
Total product demand increased 1.354 million barrels daily to 21.541 million barrels per day.
Distillate fuel oil stocks increased 1.8 million barrels from the previous report week; distillate stocks are 130.8 million barrels. National distillate demand was reported at 4.065 million barrels per day during the report week. This was a weekly increase of 106,000 barrels daily.
Propane stocks fell 0.9 million barrels from the previous report week; propane stock are 68.8 million barrels. Current demand is estimated at 989,000 barrels per day, an increase of 396,000 barrels daily from the previous report week.
Natural Gas
According to the Energy Information Administration:
Net injections are lower than the five-year average for the eighth week in a row. Net injections into storage totaled 48 Bcf for the week ending August 17, compared with the five-year (2013–17) average net injections of 52 Bcf and last year’s net injections of 45 Bcf during the same week. Working gas stocks totaled 2,435 Bcf, which is 599 Bcf lower than the five-year average and 684 Bcf lower than last year at this time..
Working gas stocks are lower than the five-year range for the third week in a row. The average rate of net injections into storage is 19% lower than the five-year average so far in the 2018 refill season. If working gas stocks match the five-year average rate of injections of 10.4 Bcf/d for the remainder of the refill season, inventories will total 3,216 Bcf on October 31, which is 344 Bcf lower than the five-year low of 3,560 Bcf.
Futures trading involves significant risk and is not suitable for everyone. Transactions in securities futures, commodity and index futures and options on future markets carry a high degree of risk. The amount of initial margin is small relative to the value of the futures contract, meaning that transactions are heavily “leveraged”. A relatively small market movement will have a proportionately larger impact on the funds you have deposited or will have to deposit: this may work against you as well as for you. You may sustain a total loss of initial margin funds and any additional funds deposited with the clearing firm to maintain your position. If the market moves against your position or margin levels are increased, you may be called upon to pay substantial additional funds on short notice to maintain your position. If you fail to comply with a request for additional funds within the time prescribed, your position may be liquidated at a loss and you will be liable for any resulting deficit. Past performance may not be indicative of future results. This is not an offer to invest in any investment program.
Powerhouse is a registered affiliate of Coquest, Inc.
Was this helpful? We’d like your feedback.
Please respond to [email protected]
Copyright © 2018 Powerhouse, All rights reserved.
