The Limits of Tariffs
- Crude oil fungibility affects markets
- Secondary tariffs unlikely to affect supply
- Pay attention for potential energy demand destruction
- Natural gas futures market reflects ample supply
Sincerely,
David Thompson, CMT
Executive Vice President
Powerhouse
(202) 333-5380
The Matrix
Fungibility. The property of something that is interchangeable or replaceable. As far back as ancient Rome, the concept was codified as res fungibilis “replaceable things”. Crude oil, with minor adjustments for grade and quality, is a fungible commodity.
Recent headlines on secondary tariffs on buyers of Russian oil have caused sharp market reactions. Crude oil fungibility is the main reason these price spikes have been transitory. Oil prices are set by the intersection of supply and demand. Secondary tariffs will not directly alter the fact that Russia still ships 800,000 bpd of crude oil to
China via the ESPO pipeline and another 200,000 bpd through the
Alashankou–Dushanzi pipeline. Secondary tariffs will not eliminate Russia’s shadow fleet of hundreds of oil tankers and therefore are unlikely to affect global crude oil supply meaningfully.
If, and it’s a substantial if, secondary tariffs are enforced, their effect may be more apparent on the demand side. If global economic activity is reduced as a result of trade frictions, the oil market could start pricing in some degree of demand destruction.
Another counterintuitive reaction is that Russia may have to further discount their barrels to find willing buyers. One price reporting agency believes Russia lowered the price of its Urals crude grade to India by $5/barrel last week. If Russia earns less per barrel, it could be incentivized to push more barrels to the market one way or another to finance its budget.
Supply/Demand Balances
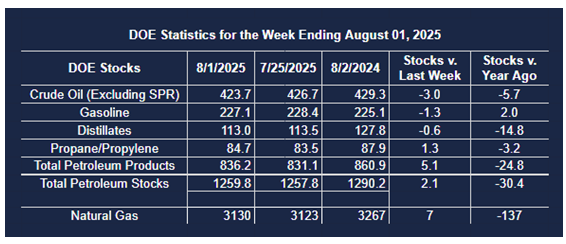
Supply/demand data in the United States for the week ended August 1, 2025, were released by the Energy Information Administration.
Total commercial stocks of petroleum increased (⬆) 2.1 million barrels to 1.2598 billion barrels during the week ended August 1st, 2025.
Commercial crude oil supplies in the United States were lower (⬇) by 3.0 million barrels from the previous report week to 423.7 million barrels.
Crude oil inventory changes by PAD District:
PADD 1: Up (⬆) 0.2 million barrels to 8.5 million barrels
PADD 2: Up (⬆) 0.3 million barrels to 103.9 million barrels
PADD 3: Down (⬇) 1.6 million barrels to 242.2 million barrels
PADD 4: Down (⬇) 0.3 million barrels to 22.8 million barrels
PADD 5: Down (⬇) 1.6 million barrels 46.3 million barrels
Cushing, Oklahoma, inventories were up (⬆) 0.4 million barrels to 23.0 million barrels.
Domestic crude oil production decreased (⬇) 30,000 barrels per day from the previous report at 13.284 million barrels per day.
Crude oil imports averaged 5.962 million barrels per day, a daily decrease (⬇) of 174,000 barrels. Exports increased (⬆) 620,000 barrels daily to 3.318 million barrels per day.
Refineries used 96.9% of capacity; an increase (⬆) of 1.5% from the previous report week.
Crude oil inputs to refineries increased (⬆) 213,000 barrels daily; there were 17.124 million barrels per day of crude oil run to facilities. Gross inputs, which include blending stocks, increased (⬆) 261,000 barrels daily to 17.522 million barrels daily.
Total petroleum product inventories increased (⬆) by 5.0 million barrels from the previous report week, down to 836.1 million barrels.
Total product demand decreased (⬇) 1,265,000 barrels daily to 20.122 million barrels per day.
Gasoline stocks decreased (⬇) 1.3 million barrels from the previous report week; total stocks are 227.1 million barrels.
Demand for gasoline decreased (⬇) 112,000 barrels per day to 9.040 million barrels per day.
Distillate fuel oil stocks decreased (⬇) 0.6 million barrels from the previous report week; distillate stocks are at 113.0 million barrels. EIA reported national distillate demand at 3.720 million barrels per day during the report week, a increase (⬆) of 115,000 barrels daily.
Propane stocks rose (⬆) 1.3 million barrels from the previous report to 84.7 million barrels. The report estimated current demand at 805,000 barrels per day, a decrease (⬇) of 284,000 barrels daily from the previous report week.
Natural Gas
Record natural gas output has allowed U.S. natural gas stockpiles to climb to 6% above average levels for this time of year – despite hotter-than-normal temperatures. Moderate daily price swings for the front-month futures contract has reduced 30-day historic volatility to the lowest level since April 2024.
The market’s assessment of winter gas supplies also appears sanguine (from a consumer’s point of view) with the March26-April26 spread falling to a low of approximately 18 cents per mmbtu.
According to the EIA:
Net injections into storage totaled 7 Bcf for the week ended August 1, compared with the five-year (2020–24) average net injections of 29 Bcf and last year’s net injections of 21 Bcf during the same week. Working natural gas stocks totaled 3,130 Bcf, which is 173 Bcf (6%) more than the five-year average and 137 Bcf (4%) lower than last year at this time.
According to The Desk survey of natural gas analysts, estimates of the weekly net change to working natural gas stocks ranged from net injections of 5 Bcf to 29 Bcf, with a median estimate of 13 Bcf.
The average rate of injections into storage is 22% higher than the five-year average so far in the refill season (April through October). If the rate of injections into storage matched the five-year average of 8.7 Bcf/d for the remainder of the refill season, the total inventory would be 3,926 Bcf on October 31, which is 173 Bcf higher than the five-year average of 3,753 Bcf for that time of year.
Was this helpful? We’d like your feedback.
Please respond to [email protected]
This material has been prepared by a sales or trading employee or agent of Powerhouse Brokers, LLC and is, or is in the nature of, a solicitation. This material is not a research report prepared by Powerhouse Brokers, LLC. By accepting this communication, you agree that you are an experienced user of the futures markets, capable of making independent trading decisions, and agree that you are not, and will not, rely solely on this communication in making trading decisions.
DISTRIBUTION IN SOME JURISDICTIONS MAY BE PROHIBITED OR RESTRICTED BY LAW. PERSONS IN POSSESSION OF THIS COMMUNICATION INDIRECTLY SHOULD INFORM THEMSELVES ABOUT AND OBSERVE ANY SUCH PROHIBITION OR RESTRICTIONS. TO THE EXTENT THAT YOU HAVE RECEIVED THIS COMMUNICATION INDIRECTLY AND SOLICITATIONS ARE PROHIBITED IN YOUR JURISDICTION WITHOUT REGISTRATION, THE MARKET COMMENTARY IN THIS COMMUNICATION SHOULD NOT BE CONSIDERED A SOLICITATION.
The risk of loss in trading futures and/or options is substantial and each investor and/or trader must consider whether this is a suitable investment. Past performance, whether actual or indicated by simulated historical tests of strategies, is not indicative of future results. Trading advice is based on information taken from trades and statistical services and other sources that Powerhouse Brokers, LLC believes are reliable. We do not guarantee that such information is accurate or complete and it should not be relied upon as such. Trading advice reflects our good faith judgment at a specific time and is subject to change without notice. There is no guarantee that the advice we give will result in profitable trades.
Copyright 2025 Powerhouse Brokers, LLC, All rights reserved