Oil Prices Facing Headwinds; TAS For Natural Gas (Henry Hub) Expanded By CME
- WTI loses over $4.00
- Exemption from Iranian oil sanctions ending by May 1
- Refinery upgrades slow product supply
- OPEC production cuts offset by Saudi replacement crude oil

The Matrix
President Trump claimed his personal diplomacy led to lower oil prices during the week ending April 25, 2019. According to press reports, Trump said he called OPEC “and told the cartel to lower oil prices… ‘I called up OPEC, I said you’ve got to bring them down.’”
This assertion follows a week in which WTI crude oil prices fell from a Tuesday high of $66.60 to Friday’s $62.28.
The decline coincided with a United States demand that buyers of Iranian oil end purchases “by May 1” or face sanctions. This move upended hopes by countries with exemptions from the sanction regime that they would be able to continue in this status. There were eight countries involved, including China and India. Japan, South Korea, Taiwan, Turkey, Italy and Greece were waiver recipients too.
The change in stance of the United States had immediate repercussions. As noted, crude oil prices fell notwithstanding an agreement among the OPEC members, Russia and other non-OPEC producers to limit output.
This had been effective in supporting global prices. Brent, the global price marker, blew past $74 on Monday, exceeding its November high. (WTI’s Monday high was its highest since October, 2018.)
After Tuesday’s move to new highs, prices fell throughout the week, losing $4.32 from high to low. Market observers believe that Saudi Arabia and the UAE will be able to replace lost volumes. Refinery maintenance planned for the second quarter is expected to see throughput down 8.5 per cent since the start of 2019. This reflects, in part, changes to support maritime low sulphur supplies, effective at the start of 2020.
Analysts expect one million barrels daily of capacity to be off-line. This could itself support prices as the year advances. In the last week of March, for instance, work on distillation towers (crude distillation units – CDU’s) and catalytic crackers allowed refiners to produce 15.85 million barrels per day. This compares with 17.5 million barrels daily at the start of the year. Higher refined product prices may prevail despite the President’s efforts to lower them.
Supply/Demand Balances
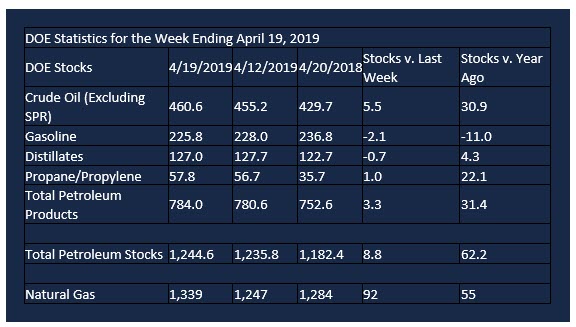
Supply/demand data in the United States for the week ending April 19, 2019 were released by the Energy Information Administration.
Total commercial stocks of petroleum increased 8.8 million barrels during the week ending April 19, 2019.
There were draws in stocks of gasoline, K-jet fuel, and distillates. There were builds in stock of fuel ethanol, residual fuel, propane, and other oils.
Commercial crude oil supplies in the United States increased 5.5 million barrels from the previous report week to 460.6 million barrels.
Crude oil supplies increased in four of the five PAD Districts. PADD 1 (East Coast) crude oil stock rose 2.6 million barrels, PADD 3 (Gulf Coast) stocks increased 0.7 million barrels, PADD 4 (Rockies) stocks advanced 0.5 million barrels, and PADD 5 (West Coast) stocks grew 0.8 million barrels.
Cushing, Oklahoma inventories increased 0.5 million barrels from the previous report week to 44.9 million barrels.
Domestic crude oil production rose 100,000 barrels be day from the previous report week to 12.2 million barrels daily.
Crude oil imports averaged 7.149 million barrels per day, a daily increase of 1.157 million barrels. Exports increased 280,000 barrels daily to 2.681 million barrels per day.
Refineries used 90.1 per cent of capacity, an increase of 2.4 percentage points from the previous report week.
Crude oil inputs to refineries increased 505,000 barrels daily; there were 16.583 million barrels per day of crude oil run to facilities. Gross inputs, which include blending stocks, rose 464,000 barrels daily to 16.910 million barrels daily.
Total petroleum product inventories rose 3.3 million barrels from the previous report week.
Gasoline stocks decreased 2.1 million barrels daily from the previous report week; total stocks are 225.8 million barrels.
Demand for gasoline decreased 11,000 barrels per day to 9.409 million barrels per day.
Total product demand increased 555,000 barrels daily to 20.448 million barrels per day.
Distillate fuel oil stocks decreased 0.7 barrels from the previous report week; distillate stocks are at 127.0 million barrels. National distillate demand was reported at 3.796 million barrels per day during the report week. This was a weekly increase of 443,000 barrels daily.
Propane stocks increased 1.0 million barrels from the previous report week; propane stock are 57.8 million barrels. Current demand is estimated at 712,000 barrels per day, an increase of 92,000 barrels daily from the previous report week.
Natural Gas
According to the Energy Information Administration:
Net injections into storage totaled 92 Bcf for the week ending April 19, compared with the five-year (2014–18) average net injections of 47 Bcf and last year’s net withdrawals of 20 Bcf during the same week. Working gas stocks totaled 1,339 Bcf, which is 369 Bcf lower than the five-year average and 55 Bcf more than last year at this time.

U.S. Natural Gas Weekly Underground Storage 2014 – 2019
source: EIAThe CME has announced expansion of the number of months TAS (Trading at Settlement) can be traded. Effective Sunday, May 19, 2019 NYMEX will allow TAS trading for Henry Hub futures to grow to the spot month and second through twelfth contract month. (No TAS trading in the spot month on the last trading day.)
Futures trading involves significant risk and is not suitable for everyone. Transactions in securities futures, commodity and index futures and options on future markets carry a high degree of risk. The amount of initial margin is small relative to the value of the futures contract, meaning that transactions are heavily “leveraged”. A relatively small market movement will have a proportionately larger impact on the funds you have deposited or will have to deposit: this may work against you as well as for you. You may sustain a total loss of initial margin funds and any additional funds deposited with the clearing firm to maintain your position. If the market moves against your position or margin levels are increased, you may be called upon to pay substantial additional funds on short notice to maintain your position. If you fail to comply with a request for additional funds within the time prescribed, your position may be liquidated at a loss and you will be liable for any resulting deficit. Past performance may not be indicative of future results. This is not an offer to invest in any investment program.
Powerhouse is a registered affiliate of Coquest, Inc.
Was this memo helpful? We’d like your feedback.
Please respond to [email protected]
Copyright© 2019 Powerhouse, All rights reserved.