Uncertainty Over 45Z Spills Over Into Diesel Pricing
- Interim guidance still remains unfinalized by the new EPA
- Airline adoption of SAF still lagging
- D4 RIN generation drops
- Natural gas futures prices may be showing a technical reversal
Sincerely,
David Thompson, CMT
Executive Vice President
Powerhouse
(202) 333-5380

The Matrix
The Administration has yet to finalize and implement the 45Z Clean Fuel Production Credit (CFPC) regulations. The period for public comment period closed on April 10th and the ongoing delay since then has had a spillover effect into the markets.
The change from the Blenders Tax Credit (BTC) to the CFPC awards the highest credit amount to the production of sustainable aviation fuel (SAF). While a credit of as much as $1.75 per gallon is helpful, SAF still currently prices at two to four times as much as traditional jet fuel. In January, the head of the International Air Travel Association said SAF use by airlines was “increasing, but disappointingly slowly”.
Conversely, renewable diesel (RD) producers, who comprise a larger share of the biofuels market than SAF producers, anticipate lower tax credits. This has caused several to reduce production. This drop in production has naturally led to a drop in D4 RIN generation (those generated by the production of RD, biodiesel, and SAF).
The chart below illustrates just how sharp the sharp drop in D4 RIN generation has been since the start of the year. D6 RINs (the top line in blue) are generated from ethanol production.

Source: TACenergy
RINs prices have now pushed a 19-month high. An earnings report from one renewable fuels producer suggested that RINs prices may need to rise another 40-50 cents in order to offset the change from the blenders tax credit to the CFPC.
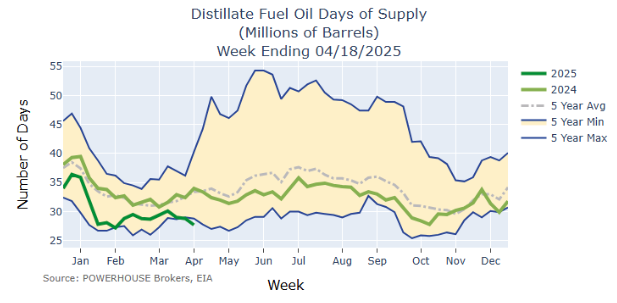
This dynamic appears to be one of the contributing factors to the relative strength on display in ULSD futures prices. Tight physical inventory levels both in PADD 1 and nationwide are also clearly contributing. Nationwide days of supply of distillate inventory remains below the low of the 5-year range.
Supply/Demand Balances
Supply/demand data in the United States for the week ended April 18, 2025, were released by the Energy Information Administration.
Total commercial stocks of petroleum decreased (⬇) 0.7 million barrels to 1.2079 billion barrels during the week ended April 18th, 2025.
Commercial crude oil supplies in the United States were higher (⬆) by 0.2 million barrels from the previous report week to 443.1 million barrels.
Crude oil inventory changes by PAD District:
PADD 1: Up (⬆) 0.6 million barrels to 8.5 million barrels
PADD 2: Up (⬆) 0.7 million barrels to 108.3 million barrels
PADD 3: Down (⬇) 1.0 million barrels to 253.4 million barrels
PADD 4: Up (⬆) 0.2 million barrels to 24.5 million barrels
PADD 5: Down (⬇) 0.2 million barrels to 48.4 million barrels
Cushing, Oklahoma, inventories were down (⬇) 0.1 million barrels to 25.0 million barrels.
Domestic crude oil production decreased (⬇) 2,000 barrels per day from the previous report at 13.460 million barrels per day.
Crude oil imports averaged 5.589 million barrels per day, a daily decrease (⬇) of 412,000 barrels. Exports decreased (⬇) 1,551,000 barrels daily to 3.549 million barrels per day.
Refineries used 88.1% of capacity; an increase (⬆) of 1.8% from the previous report week.
Crude oil inputs to refineries increased (⬆) 325,000 barrels daily; there were 15.889 million barrels per day of crude oil run to facilities. Gross inputs, which include blending stocks, increased (⬆) 379,000 barrels daily to 16.217 million barrels daily.
Total petroleum product inventories decreased (⬇) by 0.9 million barrels from the previous report week, down to 764.8 million barrels.
Total product demand increased (⬆) 1,752,000 barrels daily to 20.875 million barrels per day.
Gasoline stocks decreased (⬇) 4.5 million barrels from the previous report week; total stocks are 229.5 million barrels.
Demand for gasoline increased (⬆) 951,000 barrels per day to 9.414 million barrels per day.
Distillate fuel oil stocks decreased (⬇) 2.4 million barrels from the previous report week; distillate stocks are at 106.9 million barrels. EIA reported national distillate demand at 3.903 million barrels per day during the report week, an increase (⬆) of 45,000 barrels daily.
Propane stocks rose (⬆) 2.3 million barrels from the previous report to 46.6 million barrels. The report estimated current demand at 448,000 barrels per day, a decrease (⬇) of 613,000 barrels daily from the previous report week.
Natural Gas
Anticipation of warmer-than-normal temperatures through May 13 are likely the prime driver behind today’s nearly 7% gain in the soon-to-be front-month June NYMEX natural gas futures contract.
Should futures prices close at this level or higher, the MACD indicator will flash a very convincing reversal signal, indicating a trend change to bullish. At a minimum, even if no immediate price rally ensues, the bearish momentum of the past three weeks now seems to have paused. A move above $3.50 reference the June NYMEX natural gas contract would confer that bullish forces have regained control of the market.
According to the EIA:
- Net injections into storage totaled 88 Bcf for the week ended April 18, compared with the five-year (2020–24) average net injections of 58 Bcf and last year’s net injections of 86 Bcf during the same week. Working natural gas stocks totaled 1,934 Bcf, which is 44 Bcf (2%) lower than the five-year average and 478 Bcf (20%) lower than last year at this time.
- According to The Desk survey of natural gas analysts, estimates of the weekly net change to working natural gas stocks ranged from net injections of 56 Bcf to 81 Bcf, with a median estimate of 72 Bcf.
Was this helpful? We’d like your feedback.
Please respond to [email protected]
This material has been prepared by a sales or trading employee or agent of Powerhouse Brokers, LLC and is, or is in the nature of, a solicitation. This material is not a research report prepared by Powerhouse Brokers, LLC. By accepting this communication, you agree that you are an experienced user of the futures markets, capable of making independent trading decisions, and agree that you are not, and will not, rely solely on this communication in making trading decisions.
DISTRIBUTION IN SOME JURISDICTIONS MAY BE PROHIBITED OR RESTRICTED BY LAW. PERSONS IN POSSESSION OF THIS COMMUNICATION INDIRECTLY SHOULD INFORM THEMSELVES ABOUT AND OBSERVE ANY SUCH PROHIBITION OR RESTRICTIONS. TO THE EXTENT THAT YOU HAVE RECEIVED THIS COMMUNICATION INDIRECTLY AND SOLICITATIONS ARE PROHIBITED IN YOUR JURISDICTION WITHOUT REGISTRATION, THE MARKET COMMENTARY IN THIS COMMUNICATION SHOULD NOT BE CONSIDERED A SOLICITATION.
The risk of loss in trading futures and/or options is substantial and each investor and/or trader must consider whether this is a suitable investment. Past performance, whether actual or indicated by simulated historical tests of strategies, is not indicative of future results. Trading advice is based on information taken from trades and statistical services and other sources that Powerhouse Brokers, LLC believes are reliable. We do not guarantee that such information is accurate or complete and it should not be relied upon as such. Trading advice reflects our good faith judgment at a specific time and is subject to change without notice. There is no guarantee that the advice we give will result in profitable trades.
Copyright 2025 Powerhouse Brokers, LLC, All rights reserved