Seasonal Oil Demand Patterns Shifting
- Oil demand shows diminished seasonality
- Emerging economies have different demand patterns than older established countries
- Unexpected commentary on oil activity by the U.S. government introduces a new pricing element
- Natural gas storage is deficit to both last year and five-year average levels


The Matrix
Oil prices typically made their annual low in the first quarter of the year. Ironically, this occurred while demand in North America was at its seasonal high. Demand usually reached lows during the second quarter.
Some oil analysts are wondering if this pattern may now be shifting. Their analysis of demand over the past decade shows diminished seasonality – a flatter pattern of usage. During the past ten years, first quarter demand has become the least of the year. It rises through the rest of the year. (The analyses account for record warm winters in 2015-16 and 2016-17. They look, too, at the effect of the financial crisis during these years.)
Such a shift may be best explained by the expanding globalization of energy demand. Equatorial nations, being warmer, have strong summer cooling demand. This is tending to dampen temperate seasonality common in developed economies of the OECD.
Within the developed economies, weather and heating patterns appear to be shifting. In particular, demand for heating oil has softened, thus minimizing the effect of unusual weather, particularly in the first quarter of the year.
Prices have been notably resistant to moving lower this year. ULSD values topped out at $2.1407 on January 29th. In less than three weeks, prices lost 33.23 cents, moving to $1.8084. Since then, prices have advanced, recording new highs in the week ending April 20th. There has been little indication of weakness through this time.
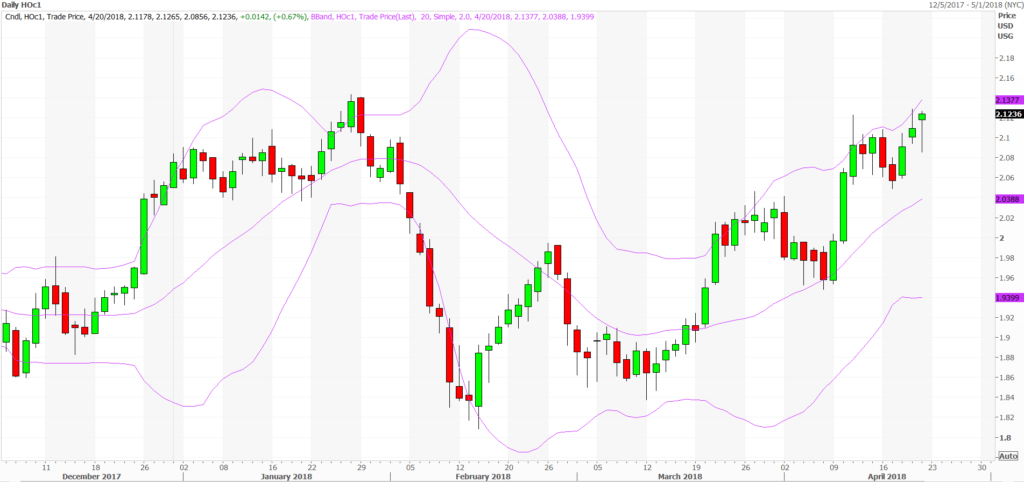
ULSD Spot Futures: Daily Prices Dec 2017 – Apr 2018 Source: CME Markets have had to deal with the impact of unexpected statements from the Federal Government. President Trump, for example, tweeted irritation that oil prices were “artificially Very High.” There was no concurrent indication of any U.S. response. Nonetheless, some reaction might be expected. A release from the Strategic Petroleum Reserve is certainly one possibility. Uncertainty can be built into prices. Following release of the President’s statement, prices moved lower, but the downward momentum has not been sustained.
Supply/Demand Balances
Supply/demand data in the United States for the week ending April 13, 2018 were released by the Energy Information Administration.
Total commercial stocks of petroleum fell 10.6 million barrels during the week ending April 13, 2018.
There were draws in stocks of gasoline, fuel ethanol, K-jet fuel, distillates, residual fuel oil, and other oils. Stocks of propane were unchanged from the previous report week.
Commercial crude oil supplies in the United States decreased to 427.6 million barrels, a draw of 1.1 million barrels.
Crude oil supplies decreased in three of the five PAD Districts. PAD District 3 (Gulf Coast) crude oil stocks fell 1.5 million barrels, PADD 4 (Rockies) crude stocks declined 0.3 million barrels, PADD 5 (West Coast) stocks retreated 0.6 million barrels. PAD District 1 (East Coast) crude stocks increased 0.4 million barrels and PADD 2 (Midwest) crude oil stocks rose 0.9 million barrels.
Cushing, Oklahoma inventories decreased 1.1 million barrels from the previous report week to 34.9 million barrels.
Domestic crude oil production increased 15,000 barrels daily to 10.540 million barrels per day from the previous report week.
Crude oil imports averaged 7.930 million barrels per day, a daily decrease of 720,000 barrels. Exports rose 544,000 barrels daily to 1.749 million barrels per day.
Refineries used 92.4 per cent of capacity, a decrease of 1.1 percentage points from the previous report week.
Crude oil inputs to refineries decreased 70,000 barrels daily; there were 16.949 million barrels per day of crude oil run to facilities. Gross inputs, which include blending stocks, declined 204,000 barrels daily to 17.151 million barrels daily.
Total petroleum product inventories saw a decrease of 9.5 million barrels from the previous report week.
Gasoline stocks declined 3.0 million barrels from the previous report week; total stocks are 236.0 million barrels.
Demand for gasoline rose 584,000 barrels per day to 9.857 million barrels daily.
Total product demand increased 1.623 million barrels daily to 21.434 million barrels per day.
Distillate fuel oil supply declined 3.1 million barrels from the previous report week to 125.3 million barrels. National distillate demand was reported at 4.356 million barrels per day during the report week. This was a weekly increase of 186,000 barrels daily.
Propane stocks were unchanged from the previous report week; propane stock are 35.9 million barrels. Current demand is estimated at 1.054 million barrels per day, a decrease of 441,000 barrels daily from the previous report week.
Natural Gas
According to the Energy Information Administration:
Working gas storage continues to post net withdrawals for the second week of the refill season. Net withdrawals from storage totaled 36 Bcf for the week ending April 13, compared with the five-year (2013–17) average net injections of 38 Bcf and last year’s net injections of 47 Bcf during the same week.
The natural gas storage refill season typically begins on April 1. However, continued colder-than-normal temperatures throughout most of the Lower 48 states have resulted in continued withdrawals from storage. This week’s report marks the second week in a row—and fifth time since 2010—that net withdrawals from storage on a national level were reported during April. Working gas stocks totaled 1,299 Bcf, which is 449 Bcf lower than the five-year average and 808 Bcf lower than last year at this time.
The storage deficit against last year and against the five-year average may explain in part why natural gas futures are holding support above $2.56. Physical markets are reportedly weaker, opening the possibility that futures could move lower yet before this shoulder season ends.
Futures trading involves significant risk and is not suitable for everyone. Transactions in securities futures, commodity and index futures and options on future markets carry a high degree of risk. The amount of initial margin is small relative to the value of the futures contract, meaning that transactions are heavily “leveraged”. A relatively small market movement will have a proportionately larger impact on the funds you have deposited or will have to deposit: this may work against you as well as for you. You may sustain a total loss of initial margin funds and any additional funds deposited with the clearing firm to maintain your position. If the market moves against your position or margin levels are increased, you may be called upon to pay substantial additional funds on short notice to maintain your position. If you fail to comply with a request for additional funds within the time prescribed, your position may be liquidated at a loss and you will be liable for any resulting deficit. Past performance may not be indicative of future results. This is not an offer to invest in any investment program.
Powerhouse is a registered affiliate of Coquest, Inc.
Was this helpful? We’d like your feedback.
Please respond to [email protected]
Copyright © 2018 Powerhouse, All rights reserved.