Futures Curve Signals Supply Concerns Amidst Trade War Headlines
- WTI Crude Futures backwardation increasing while prices fall
- ULSD Futures show a similar pattern
- Trade war headlines masking tight fundamentals
- Europe will need to increase LNG imports to fill storage
Sincerely,
Elaine Levin
President
Powerhouse
(202) 333-5380
The Matrix
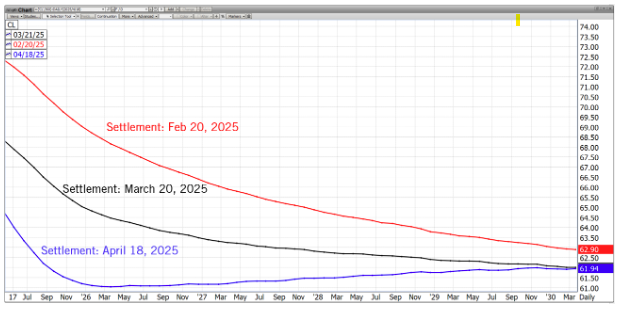
The movement of the futures curve often provides insight into the overall market direction. Relationships between futures months can offer key information about supply tightness or excess. However, current normal patterns are being overshadowed by the constant flow of news regarding tariffs and President Trump’s comments on the Federal Reserve. While broader market movements indicate demand concerns, the relative moment in energy futures are signaling something different.
Typically, the front-month futures contract sees the most activity. Traders tend to buy the front of the curve when they perceive physical tightness, driving up the price of near-term futures relative to those expiring further out. This condition, where nearby futures are more expensive than distant ones, is known as backwardation, and is generally considered a bullish indicator. Backwardation often accompanies a bull market as inventories are drawn down due to the lack of price incentive to store product.
May WTI Crude oil futures are set to expire on Tuesday, April 22nd. Crude oil prices have been under pressure, falling from over $70 per barrel at the beginning of this month to around $60 per barrel currently. Despite this price decline, the spread between May and June WTI futures contracts has widened, with the May contract now $0.70 more expensive than the June contract. This is an unusual occurrence.
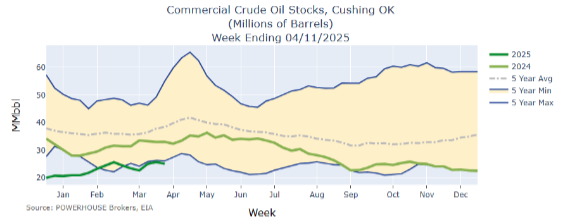
Looking at inventories at Cushing, OK, the delivery point for the WTI futures contract, supplies are tight, currently standing at 25 million barrels. Current inventories are below the 5-year range, explaining the backwardation in the crude oil futures curve.
A similar situation is observed in ULSD futures, where inventories are tight compared to historical averages, and the futures curve is in backwardation.

Overall, the economic news has been bearish. Market participants in stocks, bonds, and currencies are expressing concern about the impact of tariffs and declining investor confidence. Ultimately, this will reduce petroleum demand. However, if the trade war is resolved quickly, the backwardation in the futures market suggests that energy prices could rebound rapidly.
Supply/Demand Balances
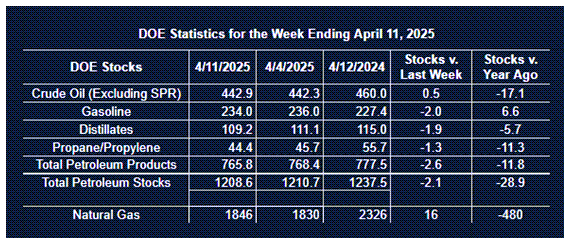
Supply/demand data in the United States for the week ended April 11, 2025, were released by the Energy Information Administration.
Total commercial stocks of petroleum decreased (⬇) 2.1 million barrels to 1.2086 billion barrels during the week ended April 11th, 2025.
Commercial crude oil supplies in the United States were higher (⬆) by 0.5 million barrels from the previous report week to 442.9 million barrels.
Crude oil inventory changes by PAD District:
PADD 1: Down (⬇) 0.4 million barrels to 7.9 million barrels
PADD 2: Down (⬇) 1.2 million barrels to 107.6 million barrels
PADD 3: Up (⬆) 0.1 million barrels to 254.4 million barrels
PADD 4: Up (⬆) 0.5 million barrels to 24.3 million barrels
PADD 5: Up (⬆) 1.8 million barrels to 48.6 million barrels
Cushing, Oklahoma, inventories were down (⬇) 0.7 million barrels to 25.1 million barrels.
Domestic crude oil production increased (⬆) 4,000 barrels per day from the previous report at 13.462 million barrels per day.
Crude oil imports averaged 6.001 million barrels per day, a daily decrease (⬇) of 189,000 barrels. Exports increased (⬆) 1,856,000 barrels daily to 5.100 million barrels per day.
Refineries used 86.3% of capacity; a decrease (⬇) of 0.4% from the previous report week.
Crude oil inputs to refineries decreased (⬇) 63,000 barrels daily; there were 15.564 million barrels per day of crude oil run to facilities. Gross inputs, which include blending stocks, decreased (⬇) 74,000 barrels daily to 15.838 million barrels daily.
Total petroleum product inventories decreased (⬇) by 2.6 million barrels from the previous report week, up to 765.7 million barrels.
Total product demand decreased (⬇) 358,000 barrels daily to 19.123 million barrels per day.
Gasoline stocks decreased (⬇) 2.0 million barrels from the previous report week; total stocks are 234.0 million barrels.
Demand for gasoline decreased (⬇) 38,000 barrels per day to 8.462 million barrels per day.
Distillate fuel oil stocks decreased (⬇) 1.9 million barrels from the previous report week; distillate stocks are at 109.2 million barrels. EIA reported national distillate demand at 3.858 million barrels per day during the report week, a decrease (⬇) of 148,000 barrels daily.
Propane stocks fell (⬇) 1.3 million barrels from the previous report to 44.4 million barrels. The report estimated current demand at 1,061,000 barrels per day, an increase (⬆) of 148,000 barrels daily from the previous report week.
Natural Gas
Natural gas futures remain under pressure from the ongoing trade war and concerns about global demand. Increasingly, U.S. natural gas prices are impacted by fundamentals abroad. It is estimated that Europe will need to import 45% more LNG to fill storage after last year’s cold winter. Analysis from Morgan Stanley shows a weak
correlation between GDP growth and Europe’s historic demand for natural gas. Therefore, ongoing tariffs should not impact Europe’s demand for LNG needed to refill storage, potentially supportive of price. What the trade war could alter is Asia’s need for imported gas, potentially freeing up more supply for Europe.
According to the EIA:
Net injections into storage totaled 16 Bcf for the week ended April 11, compared with the five-year (2020–24) average net injections of 50 Bcf and last year’s net injections of 46 Bcf during the same week. Working natural gas stocks totaled 1,846 Bcf, which is 74 Bcf (4%) lower than the five-year average and 480 Bcf (21%) lower than last year at this time.
According to The Desk survey of natural gas analysts, estimates of the weekly net change to working natural gas stocks ranged from net injections of 12 Bcf to 33 Bcf, with a median estimate of 25 Bcf.
Was this helpful? We’d like your feedback.
Please respond to [email protected]
This material has been prepared by a sales or trading employee or agent of Powerhouse Brokers, LLC and is, or is in the nature of, a solicitation. This material is not a research report prepared by Powerhouse Brokers, LLC. By accepting this communication, you agree that you are an experienced user of the futures markets, capable of making independent trading decisions, and agree that you are not, and will not, rely solely on this communication in making trading decisions.
DISTRIBUTION IN SOME JURISDICTIONS MAY BE PROHIBITED OR RESTRICTED BY LAW. PERSONS IN POSSESSION OF THIS COMMUNICATION INDIRECTLY SHOULD INFORM THEMSELVES ABOUT AND OBSERVE ANY SUCH PROHIBITION OR RESTRICTIONS. TO THE EXTENT THAT YOU HAVE RECEIVED THIS COMMUNICATION INDIRECTLY AND SOLICITATIONS ARE PROHIBITED IN YOUR JURISDICTION WITHOUT REGISTRATION, THE MARKET COMMENTARY IN THIS COMMUNICATION SHOULD NOT BE CONSIDERED A SOLICITATION.
The risk of loss in trading futures and/or options is substantial and each investor and/or trader must consider whether this is a suitable investment. Past performance, whether actual or indicated by simulated historical tests of strategies, is not indicative of future results. Trading advice is based on information taken from trades and statistical services and other sources that Powerhouse Brokers, LLC believes are reliable. We do not guarantee that such information is accurate or complete and it should not be relied upon as such. Trading advice reflects our good faith judgment at a specific time and is subject to change without notice. There is no guarantee that the advice we give will result in profitable trades.
Copyright 2025 Powerhouse Brokers, LLC, All rights reserved