Distillate Prices at Inflection Point
- ULSD price and Open Interest rising at the same time
- This signals that fresh money is coming into the market with a bullish bias
- Spot natural gas prices are now in territory last seen in 2008
Sincerely,
Alan Levine, Chairman
Powerhouse
(202) 333-5380
The Matrix
Open interest – the number of futures (and options on futures) contracts currently outstanding and not settled – is a measure of investor interest in the market. The number of ULSD contracts outstanding reached its recent high on Jan. 21, 2002, at 375,146 contracts. The price on that date settled at $2.69.
ULSD futures topped on March 9 at $4.67 per gallon. This was a breathtaking rally in response to the Ukrainian/Russian war and the intense political responses taken by the European Union and the United States. Futures gained nearly 75% of value in the $2.00 advance. During this time, Open Interest fell to 238,350 contracts.
Futures market technicians usually interpret a situation with prices rising and open interest falling as a short covering rally. Prices are moved higher as short futures holders exit their positions. This time may be no different, but the impact may have been intensified as futures exchanges, Futures Commission Merchants and other groups responsible for ensuring markets themselves remain solvent have imposed requirements for more margin, faster response to meeting margin calls and similar calls for cash. The effect on cash flow for market participants, hedgers and speculators alike has been to slow activity, widen bid-asked spreads and increase the dangers of already treacherous markets.
The demands of business activity nonetheless remain a force with which to be reckoned.
ULSD’s chart of open interest shows that despite the barriers to trading imposed by supervisory authorities, the number of contracts has started to grow.
Open interest bottomed on March 31, 2022, at 206,781 contracts. Prices settled at $3.69 on that day. In hindsight, it appears that ULSD prices were seeking a low. Prices have been moving higher after a few days of indecision and have now reached $3.96. We now have open interest rising while prices are advancing as well. Many analysts view this as confirming an upward trend.
Next resistance may be found at $4.155. A retest of $4.67 lies beyond.
Powerhouse’s David Thompson (CMT) has prepared a further analysis (“Spot ULSD futures are nearing an inflection point”) of the technical outlook for ULSD. It is available to you by emailing him at [email protected] or ICE instant message, dthompson17. Please ask.
Supply/Demand Balances
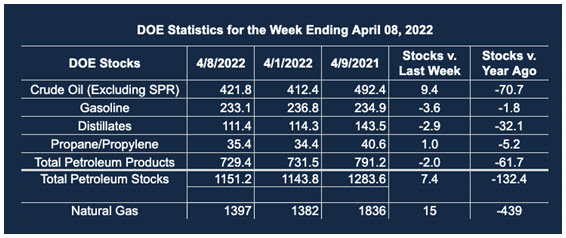
Supply/demand data in the United States for the week ended April 8, 2022, were released by the Energy Information Administration.
Total commercial stocks of petroleum rose 7.4 million barrels during the week ended April 8, 2022.
Commercial crude oil supplies in the United States increased by 9.4 million barrels from the previous report week to 412.4 million barrels.
Crude oil inventory changes by PAD District:
PADD 1: Plus 0.6 million barrels to 7.6 million barrels
PADD 2: Plus 1.9 million barrels to 107.3 million barrels
PADD 3: Plus 4.9 million barrels to 232.6 million barrels
PADD 4: Down 0.6 million barrels 24.9 million barrels
PADD 5: Plus 3.7 million barrels to 49.4 million barrels
Cushing, Oklahoma, inventories were plus 0.4 million barrels from the previous report week to 26.3 million barrels.
Domestic crude oil production was unchanged from the previous report week at 11.8 million barrels daily.
Crude oil imports averaged 5.995 million barrels per day, a daily decrease of 305,000 barrels. Exports decreased 1,513,000 barrels daily to 2.180 million barrels per day.
Refineries used 90.0% of capacity; 2.5 percentage points lower from the previous report week.
Crude oil inputs to refineries decreased 425,000 barrels daily; there were 15.523 million barrels per day of crude oil run to facilities. Gross inputs, which include blending stocks, fell 381,000 barrels daily to 16.148 million barrels daily.
Total petroleum product inventories fell 2.0 million barrels from the previous report week.
Gasoline stocks decreased 3.6 million barrels from the previous report week; total stocks are 233.1 million barrels.
Demand for gasoline rose by 174,000 barrels per day to 8.736 million barrels per day.
Total product demand decreased 1.044 million barrels daily to 18.771 million barrels per day.
Distillate fuel oil stocks decreased 2.9 million barrels from the previous report week; distillate stocks are at 111.4 million barrels. EIA reported national distillate demand at 3.484 million barrels per day during the report week, a decrease of 163,000 barrels daily.
Propane stocks increased 1.0 million barrels from the previous report week; propane stocks are at 35.4 million barrels. The report estimated current demand at 0.829 million barrels per day, a decrease of 442,000 barrels daily from the previous report week.
Natural Gas
Spot futures prices for natural gas are moving higher. Trading early on April 17 reached $7.53 and broke through resistance at $7.40, established on January 27, 2022. The current rally has been long-lived, starting on St. Patrick’s Day, March 17 at $5.00. In twenty-one trading sessions, prices have moved nearly 50% higher, reflecting expansion of exports and colder-than-normal weather.
Spot prices are now in territory last seen in 2008, when values were collapsing from $13.69. Powerhouse does not project a return to that level, but the impact of the war in Ukraine has diverted American natural gas supplies substantially.
Next resistance could be around $8.75.
The Natural Gas Weekly Update published by the Department of Energy, showed a dramatic decrease in working gas in underground storage.
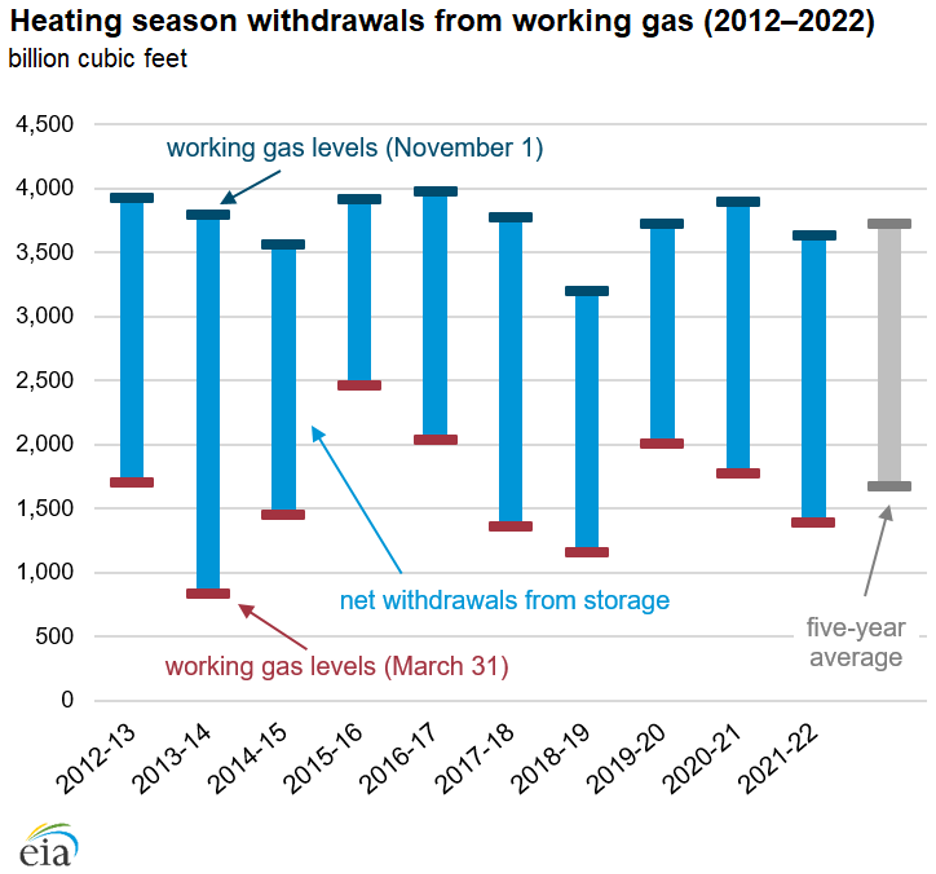
Natural Withdrawals 2012 – 2022 Source: EIA
According to the EIA:
Net injections [of natural gas] into storage totaled 15 Bcf for the week ended April 8, compared with the five-year (2017–2021) average net injections of 33 Bcf and last year’s net injections of 55 Bcf during the same week. Working natural gas stocks totaled 1,397 Bcf, which is 303 Bcf lower than the five-year average and 439 Bcf lower than last year at this time.
Was this helpful? We’d like your feedback.
Please respond to [email protected]
Powerhouse Futures & Trading Disclaimer
Copyright 2021 Powerhouse Brokerage, LLC, All rights reserved