Petroleum Markets Marking Time
- Energy futures flattened
- Inflation abating
- Oil inventories largely unchanged
- Abundant natural gas in storage
Sincerely,
Alan Levine, Chairman
Powerhouse
(202) 333-5380

The MatriCore energy futures prices flattened last week. RBOB and WTI spot futures eked out marginal gains in value; ULSD had a marginal loss. Economic data had actionable news for both bears and bulls, contributing to a sense of uncertainty for traders looking for direction.
Economic statistics indicated that inflation may be abating – one objective of Federal Reserve policy. The core consumer price index (excluding food and energy) added only 0.4% during March, a decrease in its monthly rate of growth. Costs of housing recorded their smallest gain in over a year and food prices fell.
Moderation in inflation could lead to a lower increase in the Fed’s plan of regular rate hikes. But the increase in CPI and a strong labor market are not being shrugged off by policy-makers. Some expect a 25-point increase in May, with perhaps no further increases in the Fed Funds rate after
Data in the U.S. Petroleum Balance Sheet for the week ended April 7, 2023 were notably lackluster. And with Inflation concerns at bay for now, may help explain the non-directional performance of energy prices last week.
Total commercial petroleum stocks rose 8.4 million barrels during the report week, but 6.0 million barrels of this increase was for Other Oils. Other Oils is a catch-all category including LGPLs, LRGs and various minor products. It is effectively a balancing item for inventories.
That said, commercial crude oil (+0.6 million barrels,) Motor gasoline (-0.3 million barrels,) and Distillate fuel oils (-0.6 million barrels,) hardly a ripple in the supply situation.
Domestic crude oil production rose 100,000 barrels daily during the week to 12.3 million daily barrels, a number little changed since last year.
Oil prices, then, are marking time for now, waiting for the next big thing, which is what? Further control of price inflation? An uptick in unemployment? Economic slowdown foreshadowed by slowing diesel demand? The possibilities are endless. We have not even considered geopolitical realities that may shift as China, Ukraine, Africa and nations in Asia evaluate their options and loyalties.
Supply/Demand Balances
Supply/demand data in the United States for the week ended April 7, 2023, were released by the Energy Information Administration.
Total commercial stocks of petroleum rose (⬆) 8.4 million barrels to 1,235 billion barrels during the week ended April 7, 2023.
Commercial crude oil supplies in the United States were higher (⬆) by 0.6 million barrels from the previous report week to 470.5 million barrels.
Crude oil inventory changes by PAD District:
PADD 1: Plus (⬆) 0.3 million barrels to 7.4 million barrels
PADD 2: Down (⬇) 2.2 million barrels to 120.0 million barrels
PADD 3: Plus (⬆) 1.9 million barrels to 267.5 million barrels
PADD 4: Down (⬇) 0.1 million barrels at 25.4 million barrels
PADD 5: Plus (⬆) 0.6 million barrels to 50.2 million barrels
Cushing, Oklahoma, inventories were down (⬇) 0.4 million barrels from the previous report week to 33.8 million barrels.
Domestic crude oil production was up (⬆) at 12.3 million barrels daily.
Crude oil imports averaged 6.193 million barrels per day, a daily decrease (⬇) of 951,000 barrels. Exports decreased (⬇) 2.512 million barrels daily to 2.727 million barrels per day.
Refineries used 89.3% of capacity; 0.3 percentage points lower (⬇) than the previous report week.
Crude oil inputs to refineries decreased (⬇) 30,000 barrels daily; there were 15.585 million barrels per day of crude oil run to facilities. Gross inputs, which include blending stocks, fell (⬇) 6,000 barrels daily to 16.133 million barrels daily.
Total petroleum product inventories rose (⬆) by 7.9 million barrels from the previous report week, rising to 764.2 million barrels.
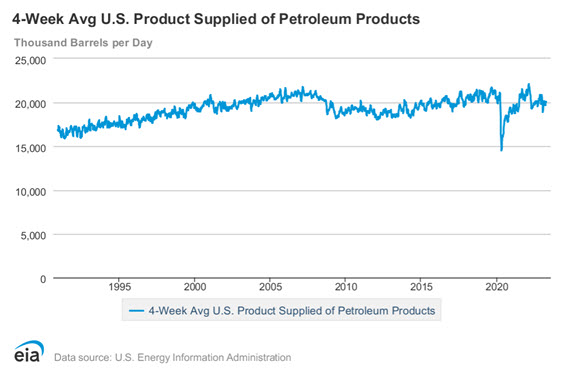
Total product demand decreased (⬇) 1.544 million barrels daily to 19.055 million barrels per day.
Gasoline stocks decreased (⬇) 0.3 million barrels from the previous report week; total stocks are 222.2 million barrels.
Demand for gasoline decreased (⬇) 360,000 barrels per day to 8.936 million barrels per day.
Distillate fuel oil stocks decreased (⬇) 0.6 million barrels from the previous report week; distillate stocks are at 112.4 million barrels. EIA reported national distillate demand at 3.763 million barrels per day during the report week, an decrease (⬇) of 478,000 barrels daily.
Propane stocks increased (⬆) by 0.5 million barrels from the previous report week to 56.2 million barrels. The report estimated current demand at 975,000 million barrels per day, an decrease (⬇) of 325,000 barrels daily from the previous report week.
Natural Gas
The withdrawal period just ended on March 31 left the country with a relative abundance of natural gas in in underground storage. Net withdrawals of natural gas were the lowest in seven years, with 1.8 Tcf in stock. This was 19% more than the average of the past five years.

Natural gas available at the start of the annual injection season has trended higher since 2014. Production of natural gas has increased during this time while consumption has fallen. Natural gas production rose 5.2 Bcf/d during 2022-23 withdrawal season, a 5.5 per cent over-the-season gain.
Consumption of natural gas was reduced largely because Heating Degree Days were 6% below normal. An unusual distribution of HDDs impacted demand as well. The Western states had 39% more HDDs than the five-year average.
Exports fell too. Pipeline outflows fell 3.8%, more than offsetting increases in LNG deliveries.
Spot natural gas futures are showing signs of a rally after several weeks of testing support. May Henry Hub futures traded at $2.314 as this week opened. Next resistance is at $2.50.
According to the EIA:
The net injections into storage totaled 25 Bcf for the week ended April 7, compared with the five-year (2018–2022) average net injections of 28 Bcf and last year’s net injections of 8 Bcf during the same week. Working natural gas stocks totaled 1,855 Bcf, which is 295 Bcf (19%) more than the five-year average and 460 Bcf (33%) more than last year at this time.
According to The Desk survey of natural gas analysts, estimates of the weekly net change to working natural gas stocks ranged from net injections of 20 Bcf to 38 Bcf, with a median estimate of 29 Bcf.
Was this helpful? We’d like your feedback.
Please respond to [email protected]
Powerhouse Futures & Trading Disclaimer
Copyright 2023 Powerhouse Brokerage, LLC, All rights reserved