Propane Market Under Pressure: Trade War Disrupts Record U.S. Export Growth
- US propane exports face challenges
- The sell-off in propane prices presents opportunities for propane buyers
- US LNG exports are also not immune to impacts of Trump’s tariffs
Sincerely,
Elaine Levin
President
Powerhouse
(202) 333-5380
The Matrix
The U.S.-China trade war is sending shockwaves through the propane market, turning a typical post-winter price decline into a far more dramatic downturn. U.S. exports of propane face significant challenges due to the escalating trade war between the U.S. and China. These market conditions present an opening for propane buyers.
Mont Belvieu 2nd Nearby Futures Continuation Chart, NYMEX
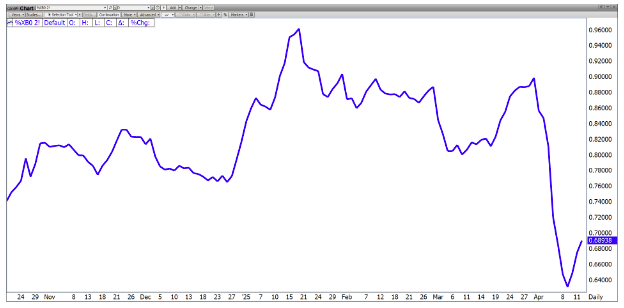
Source: FutureSource
U.S. propane exports have experienced substantial growth, increasing annually since 2007. In 2024, U.S. propane exports reached a record average of 1.8 million barrels per day, marking the highest level since data collection began in 1973. This growth in U.S. propane exports has been sustained by rising demand in Asia, particularly from China, and a favorable price differential between U.S. and global propane benchmarks.
Record U.S. propane production has been a key enabler of increased exports. Propane production, derived from natural gas processing and crude oil refining, has expanded rapidly over the past decade, driven by the growth in U.S. natural gas output. This increased production has contributed to lower U.S. propane prices relative to Asian
markets, supporting the record export volumes. China has been a significant buyer, fueled by the development of new propane dehydrogenation units that convert propane into propylene used in the manufacture of plastic.
The imposition of tariffs has significantly inflated the cost of U.S. propane for Chinese buyers. These increased costs are forcing Chinese importers to seek alternative suppliers to remain competitive. Reduced demand from China, lower seasonal demand in the U.S., and a return of higher refining runs have all pressured propane prices.
The sell-off in propane prices could offer a buying opportunity with a caveat: Propane prices normally bottom in summer. Trump’s trade war uncertainty may shift those seasonal patterns.
Propane options provide valuable flexibility in a volatile market. Purchasing call options allows propane buyers to protect against higher prices but still benefit if prices fall further. Put options can be used to establish a price floor for buyers who have already priced propane. Please contact POWERHOUSE for more information and current quotes.
(Want to learn more how companies are buying propane more competitively using futures and options? POWERHOUSE Practical Fuel Hedging on May 8-9 devotes a session on propane hedging)
Supply/Demand Balances
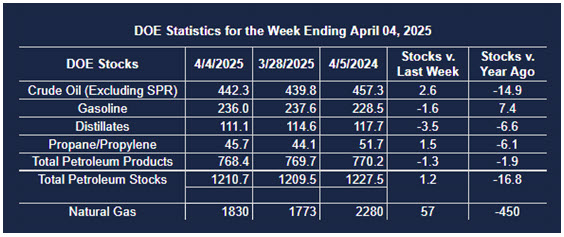
Supply/demand data in the United States for the week ended April 4, 2025, were released by the Energy Information Administration.
Total commercial stocks of petroleum increased (⬆) 1.2 million barrels to 1.2107 billion barrels during the week ended April 4th, 2025.
Commercial crude oil supplies in the United States were higher (⬆) by 2.6 million barrels from the previous report week to 442.3 million barrels.
Crude oil inventory changes by PAD District:
PADD 1: Up (⬆) 0.1 million barrels to 8.3 million barrels
PADD 2: Up (⬆) 0.2 million barrels to 108.8 million barrels
PADD 3: Up (⬆) 3.7 million barrels to 254.3 million barrels
PADD 4: Unchanged (=) at 24.1 million barrels
PADD 5: Down (⬇) 1.4 million barrels to 46.8 million barrels
Cushing, Oklahoma, inventories were up (⬆) 0.7 million barrels to 25.8 million barrels.
Domestic crude oil production decreased (⬇) 122,000 barrels per day from the previous report at 13.458 million barrels per day.
Crude oil imports averaged 6.189 million barrels per day, a daily decrease (⬇) of 277,000 barrels. Exports decreased (⬇) 637,000 barrels daily to 3.244 million barrels per day.
Refineries used 86.7% of capacity; an increase (⬆) of 0.7% from the previous report week.
Crude oil inputs to refineries increased (⬆) 69,000 barrels daily; there were 15.627 million barrels per day of crude oil run to facilities. Gross inputs, which include blending stocks, increased (⬆) 123,000 barrels daily to 15.912 million barrels daily.
Total petroleum product inventories decreased (⬇) by 1.4 million barrels from the previous report week, down to 768.3 million barrels.
Total product demand decreased (⬇) 641,000 barrels daily to 19.481 million barrels per day.
Gasoline stocks decreased (⬇) 1.7 million barrels from the previous report week; total stocks are 236.0 million barrels.
Demand for gasoline decreased (⬇) 70,000 barrels per day to 8.425 million barrels per day.
Distillate fuel oil stocks decreased (⬇) 3.5 million barrels from the previous report week; distillate stocks are at 111.1 million barrels. EIA reported national distillate demand at 4.006 million barrels per day during the report week, an increase (⬆) of 326,000 barrels daily.
Propane stocks rose (⬆) 1.5 million barrels from the previous report to 45.7 million barrels. The report estimated current demand at 913,000 barrels per day, a decrease (⬇) of 280,000 barrels daily from the previous report week.
Natural Gas
Propane is not the only energy product being impacted by the U.S.- China trade war. China has halted U.S. LNG imports, the longest trade stoppage in five years. A slowing economy and mild winter have also lowered demand from China. Chinese buyers obligated to buy on long term contracts are reselling the supply to Europe and other Asian countries.
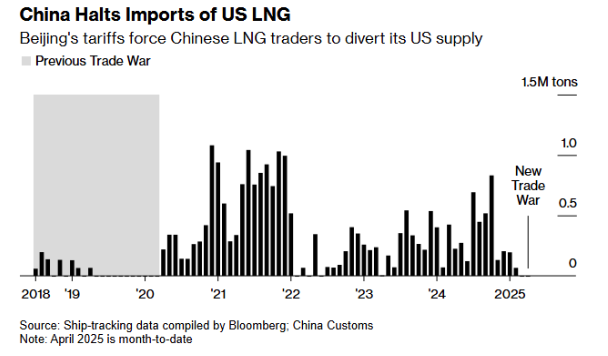
Europe, who needs to import gas to fill restorage after a cold winter, has also started to reconsider U.S. LNG supply. President Trump’s on-again, off-again tariffs are making the U.S a less reliable trading partner. However, Europe’s supply alternatives are limited if they remain committed to suspend buying from Russia.
U.S. natural gas prices have been under pressure, with futures testing $3.20, a nine-week low. $3.00 is support.
According to the EIA:
- Net injections into storage totaled 57 Bcf for the week ended April 4, compared with the five-year (2020–24) average net injections of 17 Bcf and last year’s net injections of 16 Bcf during the same week. Working natural gas stocks totaled 1,830 Bcf, which is 40 Bcf (2%) lower than the five-year average and 450 Bcf (20%) lower than last year at this time.
- According to The Desk survey of natural gas analysts, estimates of the weekly net change to working natural gas stocks ranged from net injections of 43 Bcf to 65 Bcf, with a median estimate of 56 Bcf.
Was this helpful? We’d like your feedback.
Please respond to [email protected]
This material has been prepared by a sales or trading employee or agent of Powerhouse Brokers, LLC and is, or is in the nature of, a solicitation. This material is not a research report prepared by Powerhouse Brokers, LLC. By accepting this communication, you agree that you are an experienced user of the futures markets, capable of making independent trading decisions, and agree that you are not, and will not, rely solely on this communication in making trading decisions.
DISTRIBUTION IN SOME JURISDICTIONS MAY BE PROHIBITED OR RESTRICTED BY LAW. PERSONS IN POSSESSION OF THIS COMMUNICATION INDIRECTLY SHOULD INFORM THEMSELVES ABOUT AND OBSERVE ANY SUCH PROHIBITION OR RESTRICTIONS. TO THE EXTENT THAT YOU HAVE RECEIVED THIS COMMUNICATION INDIRECTLY AND SOLICITATIONS ARE PROHIBITED IN YOUR JURISDICTION WITHOUT REGISTRATION, THE MARKET COMMENTARY IN THIS COMMUNICATION SHOULD NOT BE CONSIDERED A SOLICITATION.
The risk of loss in trading futures and/or options is substantial and each investor and/or trader must consider whether this is a suitable investment. Past performance, whether actual or indicated by simulated historical tests of strategies, is not indicative of future results. Trading advice is based on information taken from trades and statistical services and other sources that Powerhouse Brokers, LLC believes are reliable. We do not guarantee that such information is accurate or complete and it should not be relied upon as such. Trading advice reflects our good faith judgment at a specific time and is subject to change without notice. There is no guarantee that the advice we give will result in profitable trades.
Copyright 2025 Powerhouse Brokers, LLC, All rights reserved