

Crude Oil Prices Vault Higher on OPEC+ Output Cuts
- Price action bullish for crude oil and gasoline
- U.S. inventory losses add to strength
- Oil demand strong
- Natural gas storage brimming
Sincerely,
Alan Levine, Chairman
Powerhouse
(202) 333-5380
The Matrix
The holiday-shortened week ended April 6, 2023 for NYMEX pricing. The week was largely bullish for WTI crude oil and RBOB, with substantial gains in spot futures prices for each commodity. ULSD prices recorded a modest decline.
OPEC+ announced a further cut to production quotas and U.S. inventories experienced a loss of eleven million barrels of crude oil and petroleum products during the week ended March 31.
The decision to cut output by OPEC+ came as a surprise. The group’s decision to assert its market power came at a time when few alternative sources were immediately available.
Demand for oil has not abated. Alternatives like supply from U.S. shale oil have been constrained by company decisions to return cash to investors in lieu of additional investment in exploration and production. Shale oil’s position as the marginal barrel has been eroded. And with Russian crude oil under sanction, OPEC+s position has been strengthened.
The effect on crude oil prices was immediate and intense. WTI vaulted over $80 per barrel on Monday and has not fallen back—although further advances have been limited too. WTI crude oil ended March at $75.67. This holiday week saw WTI open at $80.10, ended at $80.70, with little variability during the week.
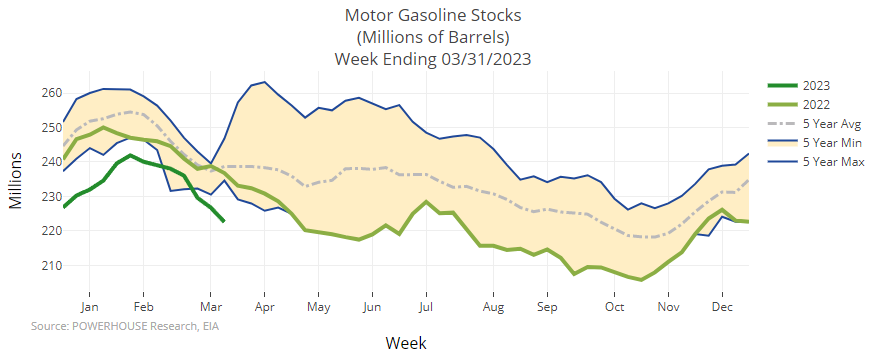
The loss of 3.7 million barrels of crude oil reported in the Weekly Petroleum Balance Sheet added to the bullish tone. Reductions in inventories of products contributed further to market jitters. Stocks of motor gasoline fell 4.1 million barrels during the last week of March, widening the shortfall against the average low of the past five years.
The move by OPEC+ has led one large financial house to raise its estimate of crude oil prices to $100 per barrel by April 2024. The bank even expects nearly 90% compliance with the new quotas, consistent with the history of its member’s previous reaction to quota requirements.
Supply/Demand Balances
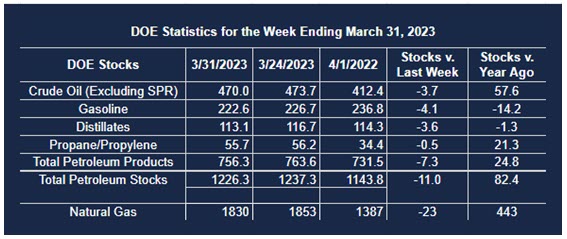
Supply/demand data in the United States for the week ended March 31, 2023, were released by the Energy Information Administration.
Total commercial stocks of petroleum fell (⬇) 11.0 million barrels to 1.226 billion barrels during the week ended March 31, 2023.
Commercial crude oil supplies in the United States were lower (⬇) by 3.7 million barrels from the previous report week to 470.0 million barrels.
Crude oil inventory changes by PAD District:
PADD 1: Plus (⬆) 0.2 million barrels to 7.1 million barrels
PADD 2: Down (⬇) 0.4 million barrels to 122.2 million barrels
PADD 3: Down (⬇) 3.2 million barrels to 265.6 million barrels
PADD 4: Unchanged (=) at 25.5 million barrels
PADD 5: Down (⬇) 0.4 million barrels to 49.6 million barrels
Cushing, Oklahoma, inventories were down (⬇) 1.0 million barrels from the previous report week to 34.2 million barrels.
Domestic crude oil production was unchanged (=) at 12.2 million barrels daily.
Crude oil imports averaged 7.144 million barrels per day, a daily increase (⬆) of 1.819 million barrels. Exports increased (⬆) 655,000 barrels daily to 5.239 million barrels per day.
Refineries used 89.6% of capacity; 0.7 percentage points lower (⬇) than the previous report week.
Crude oil inputs to refineries decreased (⬇) 198,000 barrels daily; there were 15.615 million barrels per day of crude oil run to facilities. Gross inputs, which include blending stocks, fell (⬇) 122,000 barrels daily to 16.139 million barrels daily.
Total petroleum product inventories fell (⬇) by 7.3 million barrels from the previous report week, falling to 756.3 million barrels.
Total product demand increased (⬆) 124,000 barrels daily to 20.599 million barrels per day.
Gasoline stocks decreased (⬇) 4.1 million barrels from the previous report week; total stocks are 222.6 million barrels.
Demand for gasoline increased (⬆) 151,000 barrels per day to 9.295 million barrels per day.
Distillate fuel oil stocks decreased (⬇) 3.6 million barrels from the previous report week; distillate stocks are at 113.1 million barrels. EIA reported national distillate demand at 4.240 million barrels per day during the report week, an increase (⬆) of 527,000 barrels daily.
Propane stocks decreased (⬇) by 0.5 million barrels from the previous report week to 55.7 million barrels. The report estimated current demand at 1.301 million barrels per day, an increase (⬆) of 209,000 barrels daily from the previous report week.
Natural Gas
The natural gas withdrawal period ended on March 31, with 32% more natural gas in underground storage than last year. Supplies were 19% greater than the five -year average. Powerhouse has extensively documented the failure to generate Heating Degree Days last winter, and where there was cold, demand for natural gas was relatively low.
Increased consumption of natural gas was not enough to absorb the amount in storage. Last year, demand rose to 88.5 Bcf/d, an annual increase of 5.5%. Much of this related to summer warmth and affected storage movements less.
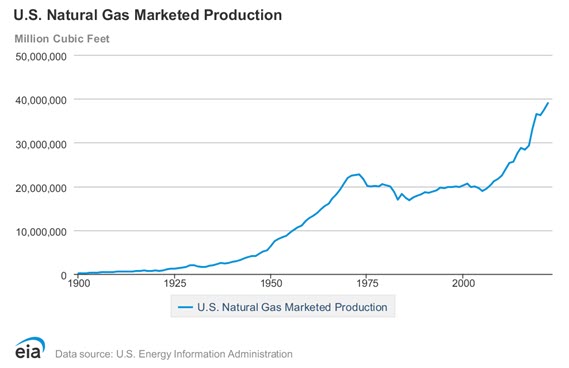
Production remained steady each year, varying roughly around 55 Bcf/d from 1968 through 2004. Production stood at 51.8 Bcf/d. Output reached 106.6 Bcf/d last year, the result of improved technology and an expanding economy.
Pennsylvania produces more natural gas than any other state but Texas. It provided nearly 20% of domestic natural gas last year, largely from the Marcellus shale gas play. Recent data from EIA show, however, that Pennsylvania’s output fell in 2022. Output of 20.5 Bcf/d was two percent lower than in 2021, when production of 20.9 Bcf/d set a record high for the state.
Improving well technology raised efficiency. Hydraulic fracturing and horizontal drilling yielded growth in output for each well, but drilling activity generally declined. In 2022, 87 permits and 24 rigs per month were in play. This contrasts with 2013 when 384 permits and 59 rigs per month were in play.
One challenge for Pennsylvania and the East coast markets it supplies is the failure of infrastructure to keep up with demand. No new interstate pipeline takeaway capacity was added in 2022. There are plans to expand infrastructure on the table, but until they are realized, regional output could suffer.
According to the EIA:
Natural gas withdrawals from storage totaled 23 Bcf for the week ended March 31, compared with the five-year (2018–2022) average net withdrawals of 0 Bcf and last year’s net withdrawals of 24 Bcf during the same week. At the end of March, which is typically considered the end of the storage withdrawal season (November–March), working natural gas stocks totaled 1,830 Bcf, which is 298 Bcf (19%) more than the five-year average and 443 Bcf (32%) more than last year at this time.
Was this helpful? We’d like your feedback.
Please respond to [email protected]
Powerhouse Futures & Trading Disclaimer
Copyright 2023 Powerhouse Brokerage, LLC, All rights reserved

