Baltimore Bridge Damage May Affect Regional Economy, Oil Prices Less So
- Unusually wide array of factors affecting oil prices
- One analyst adds $4 to crude oil prices due to Ukraine drone attacks
- GDP downtick could precede economic turndown
- A large surplus of natural gas supply could limit rally potentials
Sincerely,
Alan Levine, Chairman
Powerhouse
(202) 333-5380
The Matrix
Petroleum prices were affected by an unusually wide array of factors last week. Middle East uncertainty is paramount among the things affecting markets. The situation in the Russia-Ukraine conflict remains problematic.
These have become ongoing market influences. But familiarity does not mean Israel/Hamas and Russia/Ukraine have lost their relevance to price action. The Ukraine has scored an important advance. Its drones have damaged several Russian oil processing facilities, constraining Russian export capacity for fuel.
One analytical group believes 900,000 barrels per day of refining capacity, thus fuel exports, has been stopped for several weeks, perhaps even longer. The group has added $4 per barrel to its assessment of risk in crude oil prices.
Traders count the continuing OPEC+ limits on crude oil production quotas as bullish for price. But the global economy does not burn quotas. There is plenty of evidence that members are largely ignoring their quotas. February crude oil production from OPEC rose 110,000 barrels daily to 26.680 million daily barrels. Both Iraq and the UAE are exceeding their output limits.
Seasonality is moving into focus as another bullish price factor over the next several months. Memorial Day is the traditional beginning for over-the-road use for gasoline. A strong economy could fuel strong road fuel prices this summer.
Economic data released last week suggest a slowing of the economy. The Bureau of Economic Analysis (BEA) has estimated that the real U.S. GDP increased at an annual rate of 3.4%. This was a deceleration of the third quarter rate, 4.9%, reflecting a decline in inventory accumulation.
The collision that destroyed the Francis Scott Key Bridge at the entrance to the Port of Baltimore is likely to be a drag on regional economic activity. Baltimore’s deep-water harbor is key for many commercial imports & exports such as autos and coal. However, most petroleum products are moved through the region by pipeline. Traffic delays may impact freight rates, but at writing, this has not significantly affected local refined products prices.
Supply/Demand Balances
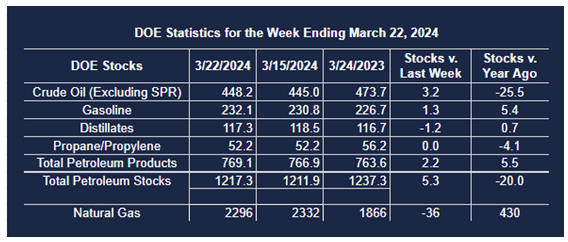
Supply/demand data in the United States for the week ended April 1, 2024, were released by the Energy Information Administration.
Total commercial stocks of petroleum fell (⬇) 5.3 million barrels to 1.2173 billion barrels during the week ended April 1, 2024.
Commercial crude oil supplies in the United States were higher (⬆) by 3.2 million barrels from the previous report week to 448.2 million barrels.
Crude oil inventory changes by PAD District:
PADD 1: Up (⬆) 0.5 million barrels at 8.8 million barrels
PADD 2: Up (⬆) 2.5 million barrels to 119.2 million barrels
PADD 3: Up (⬆) 0.4 million barrels to 248.3 million barrels
PADD 4: Down (⬇) 0.1 million barrels at 26.2 million barrels
PADD 5: Down (⬇) 0.2 million barrels to 45.7 million barrels
Cushing, Oklahoma, inventories were up (⬆) 2.1 million barrels from the previous report week to 33.5 million barrels.
Domestic crude oil production was unchanged (=) at 13.1 million barrels daily.
Crude oil imports averaged 6.702 million barrels per day, a daily increase (⬆) of 424,000 barrels. Exports decreased (⬇) 700,000 barrels daily to 4.181 million barrels per day.
Refineries used 88.7% of capacity; 0.9 percentage points higher (⬆) than the previous report week.
Crude oil inputs to refineries increased (⬆) 147,000 barrels daily; there were 15.932 million barrels per day of crude oil run to facilities. Gross inputs, which include blending stocks, increased (⬆) 166,000 barrels daily to 16.268 million barrels daily.
Total petroleum product inventories increased (⬆) by 2.2 million barrels from the previous report week, up to 769.1 million barrels.
Total product demand decreased (⬇) 212,000 barrels daily to 19.531 million barrels per day.
Gasoline stocks increased (⬆) 1.3 million barrels from the previous report week; total stocks are 232.1 million barrels.
Demand for gasoline decreased (⬇) 94,000 barrels per day to 8.715 million barrels per day.
Distillate fuel oil stocks decreased (⬇) 1.2 million barrels from the previous report week; distillate stocks are at 117.3 million barrels. EIA reported national distillate demand at 4.028 million barrels per day during the report week, an increase (⬆) of 242,000 barrels daily.
Propane stocks were unchanged (=) from the previous report week at 52.2 million barrels. The report estimated current demand at 754,000 barrels per day, a decrease (⬇) of 155,000 barrels daily from the previous report week.
Natural Gas
Natural gas stored in underground caverns is ending the annual withdrawal period with a hefty surplus. There is only one report week remaining in the winter season. DOE expects supplies to end the period with 2.3 Tcf of natural gas in storage. This is 41% higher than the average of the past five years at this time.
The market is entering a period between winter’s end and the onset of summer air conditioning demand. There is little on the maps to suggest any significant shift in the impact of weather on demand and price.
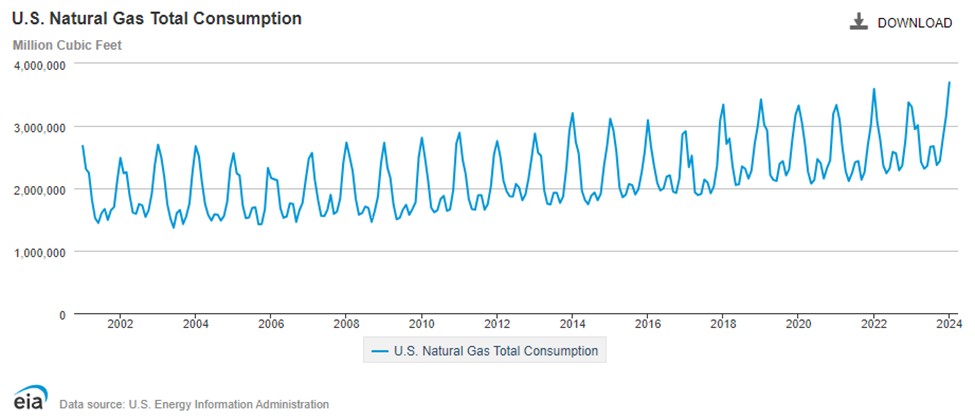
Demand for natural gas continues to make new highs. In January 2024 the United States consumed 3.696 Tcf of natural gas. The largest demand for natural gas came from the generation of electric power, 1.131 Tcf for the month. Nearly one Tcf (919 Bcf/month) was used by residential consumers, followed closely by industry, which took 802 Bcf for the month.
January tends to be the month with the highest level of consumption of natural gas. Even with underperforming HDDs recently, natural gas use has not fallen. (Dips in years 2020 and 2021 appear to be related to the pandemic, and the national economic lockdown.
Growth in natural gas demand reflects also the export of LNG, which took much of the burden of supply to Europe. European nations wanted to replace its supplier of natural gas from Russia in response to the invasion of Ukraine. American LNG made that possible. This has opened a new market for U.S. LNG which seems likely to persist in the future.
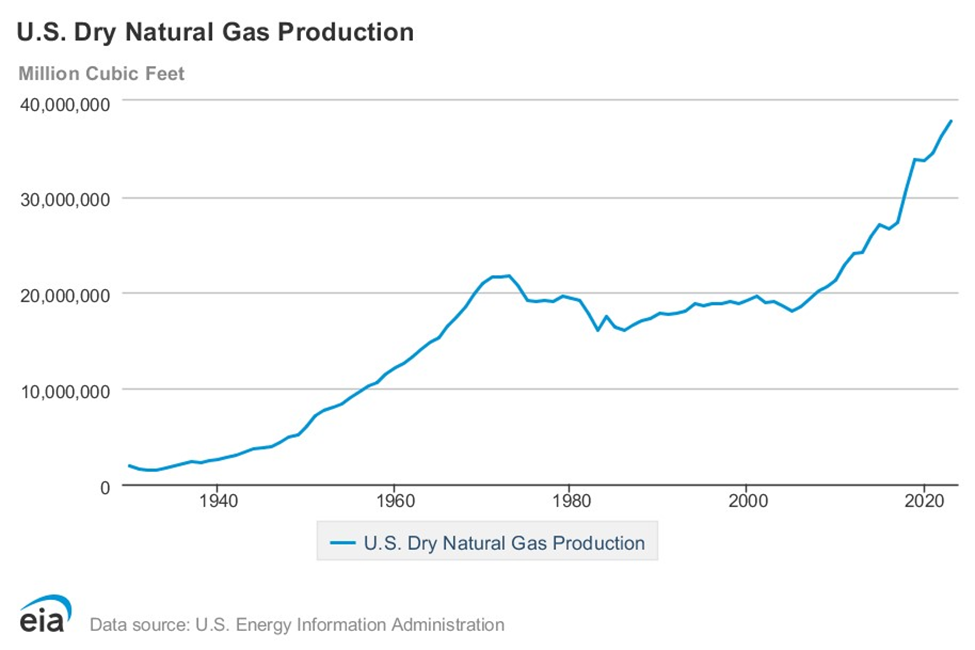
Spot natural gas futures prices have not reflected the growth in demand for American natural gas. While consumption has increased, so too has supply.
The EIA has produced a chart of annual dry gas production since 1930. After a period of flat output between 1978 and 2005, production took off with the evolution of shale gas technology. In 2005, the United States produced 18.0 Tcf of dry gas. In 2023, the last year for which there is annual data, output more than doubled to 37.9 Tcf. Natural gas is now seen as the most environmentally friendly fossil fuel. Its desirability is not likely to diminish as other alternative fuels face their challenges.
According to the EIA:
- Net withdrawals from storage totaled 36 Bcf for the week ended March 22, compared with the five-year (2019–2023) average net withdrawals of 27 Bcf and last year’s net withdrawals of 55 Bcf during the same week. Working natural gas stocks totaled 2,296 Bcf, which is 669 Bcf (41%) more than the five-year average and 430 Bcf (23%) more than last year at this time.
- According to The Desk survey of natural gas analysts, estimates of the weekly net change to working natural gas stocks ranged from net withdrawals of 24 Bcf to 40 Bcf, with a median estimate of 30 Bcf.
- The average rate of withdrawals from storage is 25% lower than the five-year average so far in the withdrawal season (November through March). If the rate of withdrawals from storage matched the five-year average of 0.7 Bcf/d for the remainder of the withdrawal season, the total inventory would be 2,302 Bcf on March 31, which is 669 Bcf higher than the five-year average of 1,633 Bcf for that time of year.
Was this helpful? We’d like your feedback.
Please respond to [email protected]
This material has been prepared by a sales or trading employee or agent of Powerhouse Brokers, LLC and is, or is in the nature of, a solicitation. This material is not a research report prepared by Powerhouse Brokers, LLC. By accepting this communication, you agree that you are an experienced user of the futures markets, capable of making independent trading decisions, and agree that you are not, and will not, rely solely on this communication in making trading decisions.
DISTRIBUTION IN SOME JURISDICTIONS MAY BE PROHIBITED OR RESTRICTED BY LAW. PERSONS IN POSSESSION OF THIS COMMUNICATION INDIRECTLY SHOULD INFORM THEMSELVES ABOUT AND OBSERVE ANY SUCH PROHIBITION OR RESTRICTIONS. TO THE EXTENT THAT YOU HAVE RECEIVED THIS COMMUNICATION INDIRECTLY AND SOLICITATIONS ARE PROHIBITED IN YOUR JURISDICTION WITHOUT REGISTRATION, THE MARKET COMMENTARY IN THIS COMMUNICATION SHOULD NOT BE CONSIDERED A SOLICITATION.
The risk of loss in trading futures and/or options is substantial and each investor and/or trader must consider whether this is a suitable investment. Past performance, whether actual or indicated by simulated historical tests of strategies, is not indicative of future results. Trading advice is based on information taken from trades and statistical services and other sources that Powerhouse Brokers, LLC believes are reliable. We do not guarantee that such information is accurate or complete and it should not be relied upon as such. Trading advice reflects our good faith judgment at a specific time and is subject to change without notice. There is no guarantee that the advice we give will result in profitable trades.
Copyright 2024 Powerhouse Brokers, LLC, All rights reserved