U.S. Energy Demand Expected to Slow
- Demand growth in Asia now focus of demand
- Mature world economies show slow growth
- U.S. distillate stocks fall 2.1 million barrels
- Net natural gas withdrawals 3 per cent lower than 5-year average

The Matrix
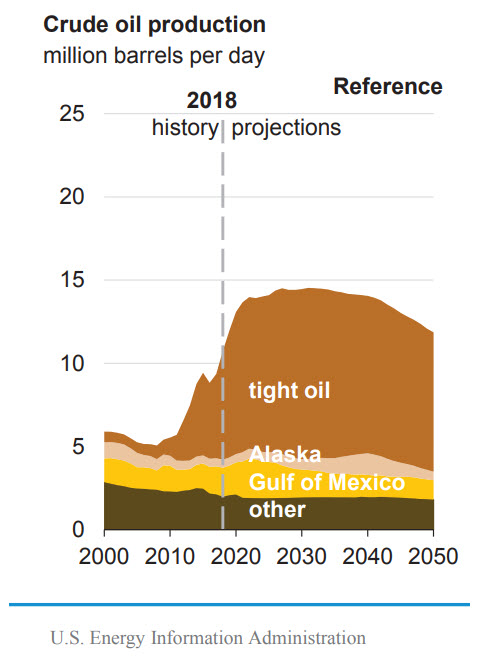
Crude oil prices remain locked in the tight range limited by OPEC+Russia assurances of heightened production control and expectations of expanding U.S. fossil fuel supply. EIA has weighed in with its Annual Energy Outlook 2019. A key conclusion is that the United States achieves status as a net energy exporter during 2020. This reflects large gains in production of crude oil, natural gas and natural gas plant liquids (NGPL.) At the same time, EIA expects slow growth in U.S. energy demand.
Expectations of slow U.S. demand reflect shifts in global economic growth. Rapid growth has been seen in Asia, the Middle East and Africa. EIA puts growth in each of these regions around 20 per cent between 2010 and 2016. Gains in consumption in the Middle East and Africa are the result of economic growth, improved access to energy markets and population growth.
These gains offset declining energy demand in China between 2015 and 2016. China had rapid growth in energy demand between 2000 and 2013. It passed the U.S. as the largest user of energy in 2009. That country has since consistently used about 40 per cent more energy than the U.S.
The mature economies of North America had consumption gains of one per cent in 2010- 2016. In Europe, energy use fell four per cent in that time.
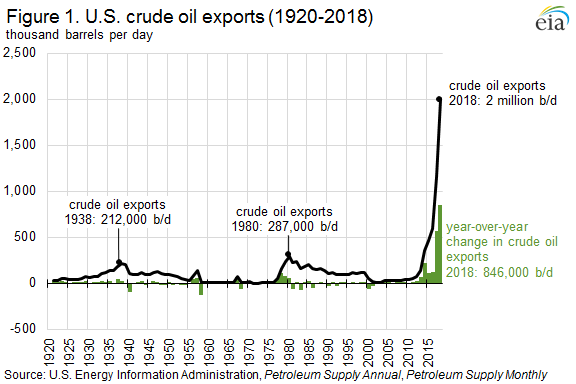
Slow growth in domestic demand may not, however, push prices lower if U.S. exports grow as expected. EIA now forecasts crude oil production to reach 13.03 million barrels daily in 2020 and NGPL of 5.25 million barrels per day.
Supply/Demand Balances
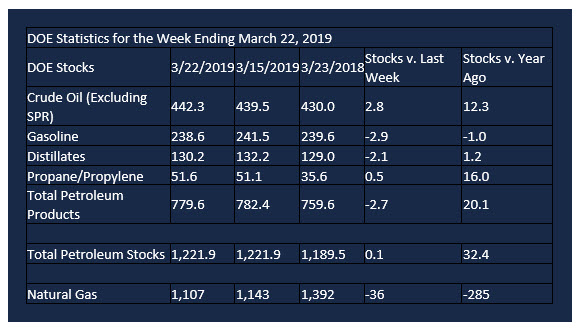
Supply/demand data in the United States for the week ending March 22, 2019 were released by the Energy Information Administration.
Total commercial stocks of petroleum increased 0.1 million barrels during the week ending March 22, 2019.
There were builds in stocks of K-Jet fuel, residual fuels, propane, and other oils. There were draws in stocks of gasoline and distillates.
Commercial crude oil supplies in the United States increased 2.8 million barrels from the previous report week to 442.3 million barrels.
Crude oil supplies increased in three of the five PAD Districts. PADD 1 (East Coast) stocks grew 0.2 million barrels, PADD 3 (Gulf Coast) stocks rose 4.6 million barrels, and PADD 4 (Rockies) stocks increased 0.7 million barrels. PADD 2 (Midwest) stocks declined 1.5 million barrels and PADD 5 (West Coast) stocks fell 1.0 million barrels.
Cushing, Oklahoma inventories increased 0.5 million barrels from the previous report week to 46.9 million barrels.
Domestic crude oil production was unchanged from the previous report week at 12.1 million barrels per day.
Crude oil imports averaged 6.540 million barrels per day, a daily decrease of 392,000 barrels. Exports decreased 506,000 barrels daily to 2.886 million barrels per day.
Refineries used 86.6 per cent of capacity, a decrease of 2.3 percentage points from the previous report week.
Crude oil inputs to refineries decreased 367,000 barrels daily; there were 15.831 million barrels per day of crude oil run to facilities. Gross inputs, which include blending stocks, rose 422,000 barrels daily to 16.114 million barrels daily.
Total petroleum product inventories fell 2.7 million barrels from the previous report week.
Gasoline stocks decreased 2.9 million barrels from the previous report week; total stocks are 238.6 million barrels.
Demand for gasoline decreased 285,000 barrels per day to 9.124 million barrels per day.
Total product demand decreased 1.362 million barrels daily to 20.130 million barrels per day.
Distillate fuel oil stocks decreased 2.1 million barrels from the previous report week; distillate stocks are at 130.2 million barrels. National distillate demand was reported at 4.216 million barrels per day during the report week. This was a weekly decrease of 489,000 barrels daily.
Propane stocks increased 0.5 million barrels from the previous report week; propane stock are 51.6 million barrels. Current demand is estimated at 1.005 million barrels per day, a decrease of 248,000 barrels daily from the previous report week.
Natural Gas
According to the Energy Information Administration:
Net withdrawals from storage totaled 36 Bcf for the week ending March 22, compared with the five-year (2014–18) average net withdrawals of 41 Bcf and last year’s net withdrawals of 66 Bcf during the same week. Working gas stocks totaled 1,107 Bcf, which is 551 Bcf lower than the five-year average and 285 Bcf lower than last year at this time.
The average rate of net withdrawals from storage is 3% lower than the five-year average so far in the withdrawal season (November through March). If the rate of withdrawals from storage matched the five-year average of 2.4 Bcf/d for the remainder of the withdrawal season, total inventories would be 1,085 Bcf on March 31, which is 551 Bcf lower than the five-year average of 1,636 Bcf for that time of year.
Futures trading involves significant risk and is not suitable for everyone. Transactions in securities futures, commodity and index futures and options on future markets carry a high degree of risk. The amount of initial margin is small relative to the value of the futures contract, meaning that transactions are heavily “leveraged”. A relatively small market movement will have a proportionately larger impact on the funds you have deposited or will have to deposit: this may work against you as well as for you. You may sustain a total loss of initial margin funds and any additional funds deposited with the clearing firm to maintain your position. If the market moves against your position or margin levels are increased, you may be called upon to pay substantial additional funds on short notice to maintain your position. If you fail to comply with a request for additional funds within the time prescribed, your position may be liquidated at a loss and you will be liable for any resulting deficit. Past performance may not be indicative of future results. This is not an offer to invest in any investment program.
Powerhouse is a registered affiliate of Coquest, Inc.
Was this helpful? We’d like your feedback.
Please respond to [email protected]
Copyright© 2019 Powerhouse, All rights reserved.