Excerpted From This Week in Petroleum

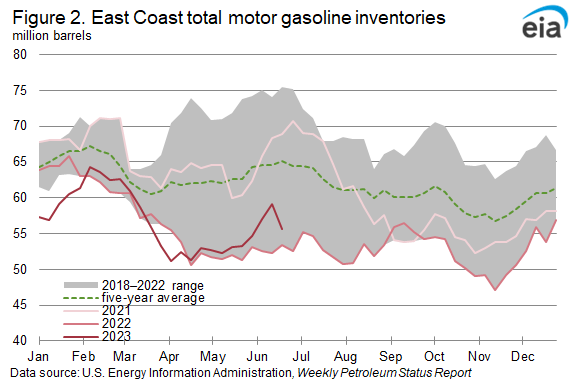
Gasoline inventories in the East Coast region have increased despite refinery issues affecting gasoline production. At the Phillips 66 refinery in Bayway, New Jersey, the fluid catalytic cracker (FCC), primarily used for producing additional gasoline in refining, came offline and is expected to reduce gasoline production by 100,000 barrels per day (b/d), according to trade press reports. Repairs to the FCC are expected to be made over the next few weeks, and gasoline production should increase once the unit is back online.
Although the Bayway refinery is expected to remain operational while repairs are made to the FCC unit, gross inputs into refineries in the East Coast region have fallen. As of June 23, gross inputs into refineries in the East Coast region averaged 678,000 b/d, down from 806,000 b/d the week of June 2. The extent that recent declines in gross inputs can be attributed to Bayway is unclear, but the combination of an offline FCC unit and lower regional refinery runs will limit the volume of gasoline supplied by regional refineries.
Aside from refinery production within PADD 1, the region receives gasoline from pipeline shipments from other regions, from waterborne imports, and from waterborne shipments from the U.S. Gulf Coast (PADD 3). Data from Vortexa Analytics indicate that waterborne shipments from the U.S. Gulf Coast to the East Coast are generally steady, although down slightly from the May average. June shipments from the Gulf Coast to the East Coast averaged 237,000 b/d (through June 23), down from 249,000 b/d in May. Despite the slight decrease, gasoline price premiums in the East Coast region compared with the Gulf Coast will likely support gasoline shipments to the East Coast.
As of June 27, the spot price for New York RBOB was $2.55 per gallon (gal), a nearly $0.17/gal premium compared with Gulf Coast RBOB. Between June 1 and June 27, New York RBOB averaged a $0.13/gal premium compared with Gulf Coast RBOB, up from a premium of $0.08/gal last June. The East Coast premium will likely prompt continued gasoline shipment from the Gulf Coast to the East Coast. With pipeline constraints and limited numbers of coast-wise compliant ships, however, the timing and degree of any possible increased shipping between the regions may be limited. Imports are the most flexible source of supply and could increase, given the other sources’ limitations.
Our data indicate that gasoline imports into the U.S. East Coast have increased over the past few months, which follows seasonal trends (Figure 3). Gasoline imports (based on the four-week moving average) into the East Coast hit a 2023 low of 386,000 b/d in March but increased to 813,000 b/d in June (monthly estimates based on weekly data through June 23). In addition to the relatively high gasoline prices on the East Coast, lower shipping rates are also supporting gasoline imports. According to data from Bloomberg, the price for a medium range (MR) clean product tanker from the United Kingdom and European continent (UKC) to the U.S. Atlantic Coast fell from an average of $43 per metric ton in March to an average of $29/metric ton in June (through June 23).

Data from Vortexa Analytics indicate that between March and June (data through June 23), gasoline imports from Europe into the East Coast increased by 205,000 b/d, the primary factor behind the increased imports. Beginning in April of this year, Europe’s gasoline exports to the U.S. East Coast have been greater than exports to West Africa (Figure 4), a reverse of the typical trend. Other long periods when exports to the East Coast were higher than to West Africa were during U.S. refinery and transportation disruptions, such as the months following the severe winter storm in February 2021 and after the explosion of the Philadelphia Energy Solutions refinery.

The East Coast consumes the largest volumes of gasoline in the United States, based on our Petroleum Supply Monthly, although we don’t have regional demand data at the weekly level. Between April 2022 and March 2023 (the last 12 months for which data are available), East Coast gasoline consumption accounted for 34% of total U.S. gasoline consumption (measured as product supplied). As of June 23, weekly U.S. gasoline consumption averaged 9.3 million b/d, which is below the pre-pandemic 2015–2019 range for this time of year (Figure 5). With relatively low gasoline demand, current market dynamics will likely continue to keep the East Coast sufficiently supplied with gasoline.