
By Kelly Flannery, Risk Analyst; Hallie Cooley, Senior Data Analyst; Christopher Geldes, Data Analyst; and Kelly Billings, Vice President
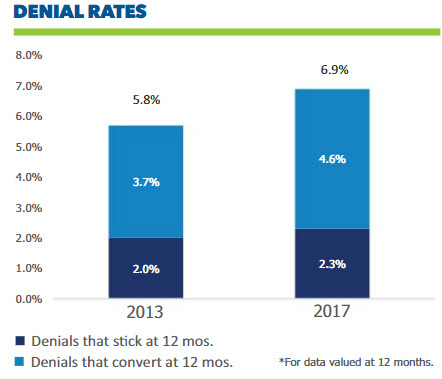
A Lockton Analytics study shows that [worker’s comp] claim denial rates increased from 5.8 percent to 6.9 percent between 2013 and 2017.* Lockton’s claim denial benchmarking study digs into this increase in denials and addresses how it is impacting employers. Employers have access to more data than ever before and are increasingly using it to drive decisions. This study suggests that there is opportunity for improvement.
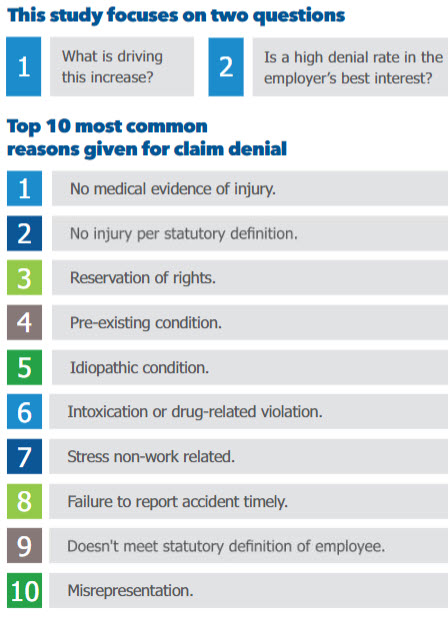
Claim denial management is a part of most employers’ risk management practices. Claim adjusters strive to strike the right balance between accepting legitimate claims and denying those without merit. Adjusters often give multiple reasons for denial. Frequent reasons for denying a claim relate to whether it occurred during the course and scope of employment, and include the following:
- No medical evidence of injury
- Not related to work
- Not a statutory employee
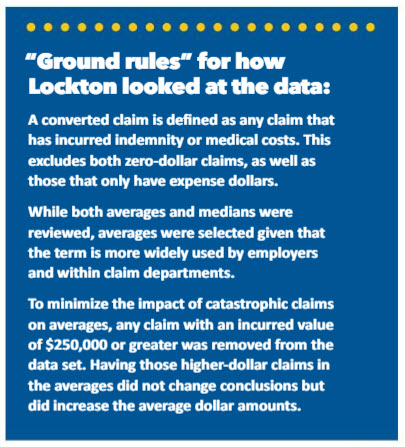
While some of these denials are sustained and do not pay out, Lockton Analytics found that on average, 67 percent of initial denials convert to paid claims by 12 months. Think about that for a minute: on average, more than two out of three denied claims will pay out! In an ideal world, employers would have deniable sustainability of 100 percent, with no claims that convert to a paid status.
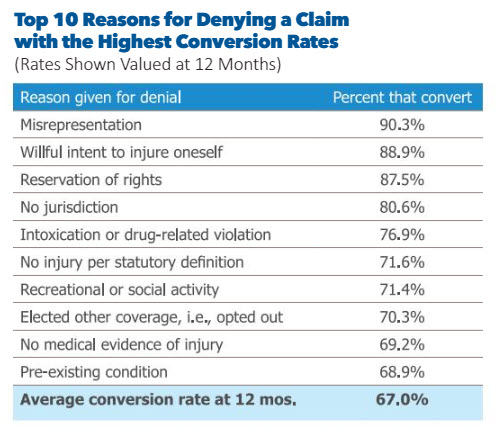
When considering the reasons for denial, it might be worth knowing that some have much higher conversion rates than others.

Aggressively denying claims saves money, right?
Not so fast! Let’s take a closer look.
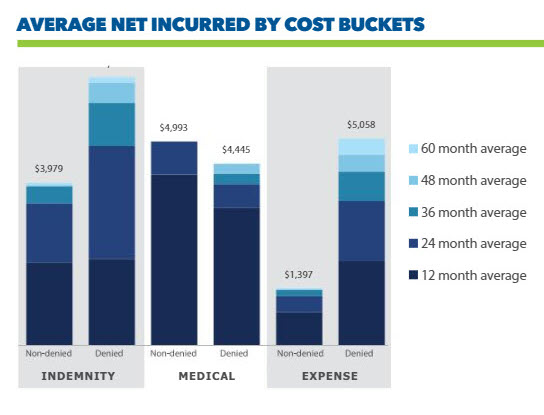
Lockton found that the average net incurred value of a claim that is accepted and pays out is $10,153. However, the average for a claim that is denied, and then pays out, is $15,694. That is a 55 percent increase for denied claims!
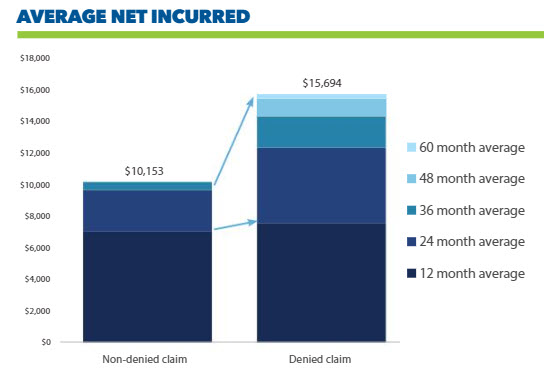
It is worth noting that while non-denied claims have some minor development after 36 months, denied claims still see significant development for at least an additional two years. Lockton’s study stopped at 60 months because more than 97 percent of claims were closed by that point, regardless of denial status.
Expense on denied claims is nearly triple the amount of non-denied claim expense, making it the primary driver of the wedge between denied and non-denied costs.
Indemnity is also less favorable on average for denied claims by about $2,585.
The only bucket that is favorably impacted by denying claims is medical costs, where employers average a $548 decrease.
The extra effort involved in denial management, which often includes litigation, can trip up efforts to manage overall costs.
Industry Matters
Often, employers feel that benchmarks may not apply to them because operating and financial metrics can vary by industry. Lockton’s study confirms that significant differences exist in average claim costs across industries. We selected the three industries in the study with the highest claim volume for a deeper dive.

In every industry, converted denials cost more than non-denied claims. But some industries have significant variations from the overall averages. Healthcare (NAICS Industry 62) experiences lower average net incurred costs than overall norms. However, Administrative and Support and Waste Management and Remediation Services (NAICS Industry 56) and Manufacturing (NAICS Industries 31, 32 and 33) incur higher claim costs than the national average.

Geography Matters
Denial outcomes vary by state due to state-specific regulations and differing legal issues. Employers with a high employee concentration in one state will want to consider that state’s characteristics when comparing to benchmarks. Lockton looked into the three states with the highest claim counts in the study: California, Florida and Texas.
California has a very high conversion rate compared to the national average, while a lower percentage of denials convert in Florida and Texas. Texas has seen that conversion rate climb rapidly during the past five years from about 47 percent in 2013 to 61 percent in 2017.
When we look at average claim costs by state, California has much higher net incurred values than the national averages for both non-denied and denied claims. This state is prone to much higher litigation rates than others and has the highest ratio of loss adjustment expense (LAE) to losses. Florida experiences incurred costs that are slightly favorable to national averages. Texas is at the opposite end of this spectrum from California, with lower than average net incurred costs. Texas even tends to see a benefit on denied claims.
Litigation is Impactful
It should be no surprise that 70.6 percent of denied lost-time claims will be litigated, which is more than twice the litigation rate for non-denied lost time claims of 27.5 percent. While some employees may be able to appeal denials without legal counsel, many do not have the legal background required to successfully move forward.
Attorney involvement is a significant cost driver in denied claims. It is in an employer’s best interest to be cognizant of workers’ rights and what constitutes adequate compensation from the start.

While many outcomes are possible, the decision between accepting and denying a claim can lead to a large variance in the average outcome.
How should I use this information?
Consider the practices by your company in relation to the above benchmarks. Are you tracking your denial rates and measuring the effectiveness of your denial practices? If denial rates and costs are substantially higher or lower than those outlined in this report, consider the “Why?”
Keep in mind that the initial denial rate is only the first piece of the story. Take a closer look at your company’s converted denial rate, and whether savings from indemnity and medical costs are enough to offset increased expense on denied claims that end up paying out. Many times, that expense could have been saved if the claim had been paid from the outset.
These benchmarks can help identify potential opportunity for improvement, especially when paired with variables such as industry, geography and employee age. Additional considerations not addressed in this paper can include nature and cause of injury, employee tenure, and drilling further into litigation status.
Ask your claims department to look at your claim management practices and costs, and consider the position of your company against the above benchmarks. If your company results differ, Lockton can help you determine what is driving your outcomes, and perhaps drive improvement to your company’s bottom line.

More than 6,000 professionals at Lockton provide 50,000 clients around the world with risk management, insurance and employee benefits consulting services that improve their businesses. For more information, contact Greg Cushard, Sr. Vice President Lockton Insurance Brokers at cell: 916-730-4849 or office: 415-568-4115, email: [email protected]