

Crude Oil, Gasoline, On Pace to Move Higher
- Drop in crude oil inventory bullish
- Distillate fuel oil futures are range-bound
- Biofuels displacing fossil transportation fuel on the West Coast
- Surplus in natural gas supply is bearish for price.
Sincerely
Alan Levine, Chair
Powerhouse
(202) 333-5380
The Matrix
Futures prices for WTI crude oil and gasoline worked higher last week. Both commodities’ uptrends established in early December remain intact, though some technical measures show these trends ebbing.
WTI spot futures easily held support just above $80 but remained well below nearby resistance just below $90. The U.S. Petroleum Balance for the Week Ended April 19 reported a decline in crude oil inventory of 6.4 million barrels. This was consistent with the continuing rally, but the soft close raises a question of whether a pullback might be coming. (The comment on implied volatility for natural gas options also applies to option premiums for liquids.)
Elliott Wave counts a call for WTI crude oil above $90. Its target for RBOB is $3.00, but significant chart resistance at $2.80 must be breached first.
Distillate demand slowed because of evidence of lower economic activity and the mandated introduction of biofuels in California.
Prices for distillate fuel oil were range-bound, unable to break out of their recent $2.50-$2.59 limits. Demand has been soft. EIA has cited the failure to generate HDDs last winter as one cause. The Agency estimates heating oil accounts for 10-15% of first quarter distillate fuel oil demand, but last winter saw a 6% reduction.
Other reasons for distillate demand slowing were evidence of lower economic activity and mandated introduction of biofuels in California.
Distillate fuel oil demand reached a recent weekly peak in December 2021, at 4.9 million barrels per day. Consumption has fallen since then, reaching 3.8 million daily barrels over the past few spring seasons.
Demand for the week ended April 19 was estimated at 3.6 million barrels daily. (A low of 2.7 million barrels consumed on May 29, 2020, was an outlier; it was pandemic-induced. Use recovered rapidly.)
These most recent demand estimates reflect the displacement of fossil fuel-based distillates by renewable diesel and biodiesel along the West Coast. This appears to be a permanent shift in regional demand patterns.

PADD V consumed 129,000 barrels daily of renewable diesel in January, and 12,000 barrels per day of biodiesel against a District-wide distillate demand of 330,000 barrels per day, the lowest monthly demand since May 1966.
Supply/Demand Balances
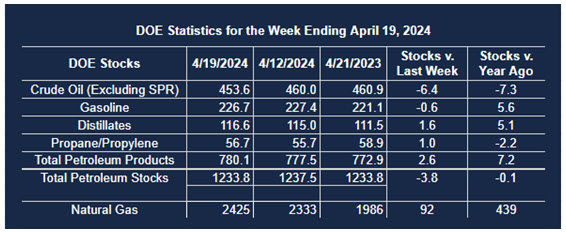
Supply/demand data in the United States for the week ended April 19, 2024, were released by the Energy Information Administration.
Total commercial stocks of petroleum decreased (⬇) 3.8 million barrels to 1,233.8 billion barrels during the week ended April 19, 2024.
Commercial crude oil supplies in the United States were lower (⬇) by 6.4 million barrels from the previous report week to 453.6 million barrels.
Crude oil inventory changes by PAD District:
PADD 1: Down (⬇) 0.3 million barrels at 8.3 million barrels
PADD 2: Up (⬆) 0.9 million barrels to 119.9 million barrels
PADD 3: Down (⬇) 6.1 million barrels to 254.8 million barrels
PADD 4: Down (⬇) 0.4 million barrels at 25.1 million barrels
PADD 5: Down (⬇) 0.5 million barrels to 45.5 million barrels
Cushing, Oklahoma, inventories were lower (⬇) at 32.4 million barrels.
Domestic crude oil production was unchanged (=) at 13.1 million barrels daily.
Crude oil imports averaged 6.497 million barrels per day, a daily increase (⬆) of 36,000 barrels. Exports increased (⬆) 453,000 barrels daily to 5.179 million barrels per day.
Refineries used 88.5% of capacity; 0.4 percentage points higher (⬆) than the previous report week.
Crude oil inputs to refineries decreased (⬇) 42,000 barrels daily; there were 15.871 million barrels per day of crude oil run to facilities. Gross inputs, which include blending stocks, increased (⬆) 72,000 barrels daily to 16.3 million barrels daily.
Total petroleum product inventories increased (⬆) by 2.7 million barrels from the previous report week, up to 780.2 million barrels.
Total product demand increased (⬆) 315,000 barrels daily to 19.535 million barrels per day.
Gasoline stocks decreased (⬇) 0.7 million barrels from the previous report week; total stocks are 226.7 million barrels.
Demand for gasoline decreased (⬇) 239,000 barrels per day to 8.423 million barrels per day.
Distillate fuel oil stocks increased (⬆) 1.6 million barrels from the previous report week; distillate stocks are at 116.6 million barrels. EIA reported national distillate demand at 3.552 million barrels per day during the report week, a decrease (⬇) of 114,000 barrels daily.
Propane stocks rose (⬆) 1 million barrels from the previous report to 56.7 million barrels. The report estimated current demand at 439,000 barrels per day, a decrease (⬇) of 236,000 barrels daily from the previous report week.
Natural Gas
Natural gas inventories remain robust. EIA reported that supplies of natural gas in underground storage grew 92 Bcf for the week ended April 19. Stocks are 37% higher than the average of the past five years at this time.
Spot natural gas futures are hugging the lower end of recent trading slightly above the $1.907 low recently established. June futures settled at $1.923 last week. Historical volatility has been idling around 40%. Implied volatility, (a measure based on option values) is retreating from its highs, pointing toward lower option premiums. This is helpful to hedgers seeking to establish length for next winter.

Bearish pressure on natural gas futures prices contrasts with the Department of Energy reporting U.S. natural gas consumption setting annual and monthly records during 2023.
Demand for natural gas was 89.1 billion cubic feet per day (Bcf/d) last year. This was a record and represents a 4% annual growth since 2018.
Monthly demand set new records from March through November of 2023. Gains in the use of natural gas in power generation have been notable. They reflect the replacement of coal-fired plants by natural gas.
Record demand also meets a market with more than adequate supplies. Robust storage has been supplemented by recovery at the Freeport Texas export terminal. Once the damaged train is fully operational, however, the two other trains are scheduled to be closed for maintenance. Natural gas that would have been processed there for export will be made available for domestic markets, a bearish feature for price.
Moreover, the growth of European markets for U.S. gas exports may be inhibited this year. Gas storage in Europe was reported as 62% full as of April 22. The five-year seasonal average for this time of year is 45% full.
According to the EIA:
- Net injections into storage totaled 92 Bcf for the week ended April 19, compared with the five-year (2019–2023) average net injections of 59 Bcf and last year’s net injections of 77 Bcf during the same week. Working natural gas stocks totaled 2,425 Bcf, which is 655 Bcf (37%) more than the five-year average and 439 Bcf (22%) more than last year at this time.
- According to a survey of natural gas analysts by The Desk, estimates of the weekly net change to working natural gas stocks ranged from net injections of 74 Bcf to 95 Bcf, with a median estimate of 87 Bcf.
Was this helpful? We’d like your feedback.
Please respond to [email protected]
This material has been prepared by a sales or trading employee or agent of Powerhouse Brokers, LLC and is, or is in the nature of, a solicitation. This material is not a research report prepared by Powerhouse Brokers, LLC. By accepting this communication, you agree that you are an experienced user of the futures markets, capable of making independent trading decisions, and agree that you are not, and will not, rely solely on this communication in making trading decisions.
DISTRIBUTION IN SOME JURISDICTIONS MAY BE PROHIBITED OR RESTRICTED BY LAW. PERSONS IN POSSESSION OF THIS COMMUNICATION INDIRECTLY SHOULD INFORM THEMSELVES ABOUT AND OBSERVE ANY SUCH PROHIBITION OR RESTRICTIONS. TO THE EXTENT THAT YOU HAVE RECEIVED THIS COMMUNICATION INDIRECTLY AND SOLICITATIONS ARE PROHIBITED IN YOUR JURISDICTION WITHOUT REGISTRATION, THE MARKET COMMENTARY IN THIS COMMUNICATION SHOULD NOT BE CONSIDERED A SOLICITATION.
The risk of loss in trading futures and/or options is substantial and each investor and/or trader must consider whether this is a suitable investment. Past performance, whether actual or indicated by simulated historical tests of strategies, is not indicative of future results. Trading advice is based on information taken from trades and statistical services and other sources that Powerhouse Brokers, LLC believes are reliable. We do not guarantee that such information is accurate or complete and it should not be relied upon as such. Trading advice reflects our good faith judgment at a specific time and is subject to change without notice. There is no guarantee that the advice we give will result in profitable trades.
Copyright 2024 Powerhouse Brokers, LLC, All rights reserved

